Flat Session Statistics MT4

  • Indicateurs
  • Keijinro Mizutani
    Keijinro Mizutani
    Hello, I’m kotoha, a system designer focused on research-driven, rule-based trading tools for the MT5 platform.
    My work centers on market structure analysis, swing dynamics, and Fibonacci-based logic.
  • Version: 1.3
  • Activations: 5

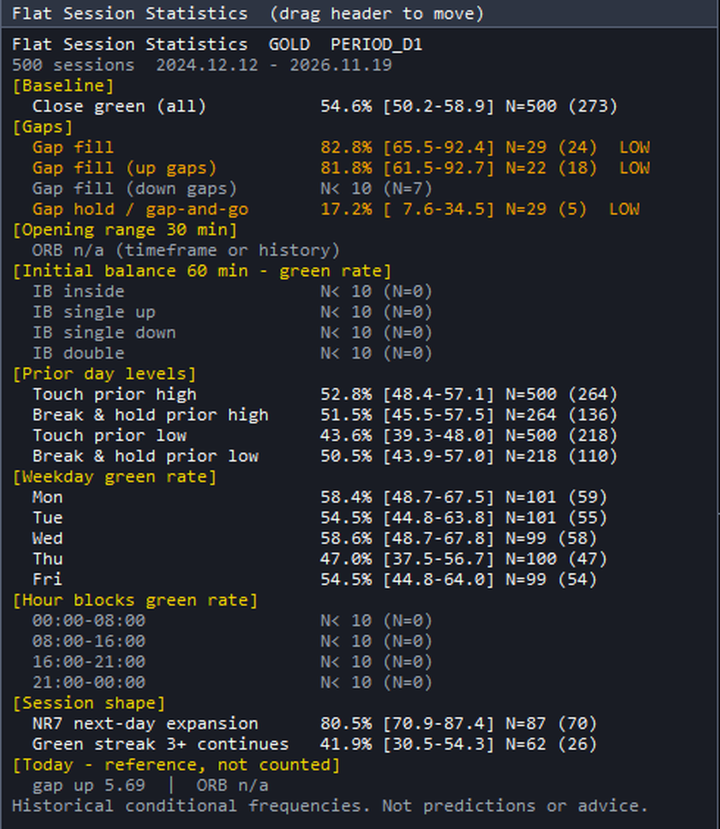
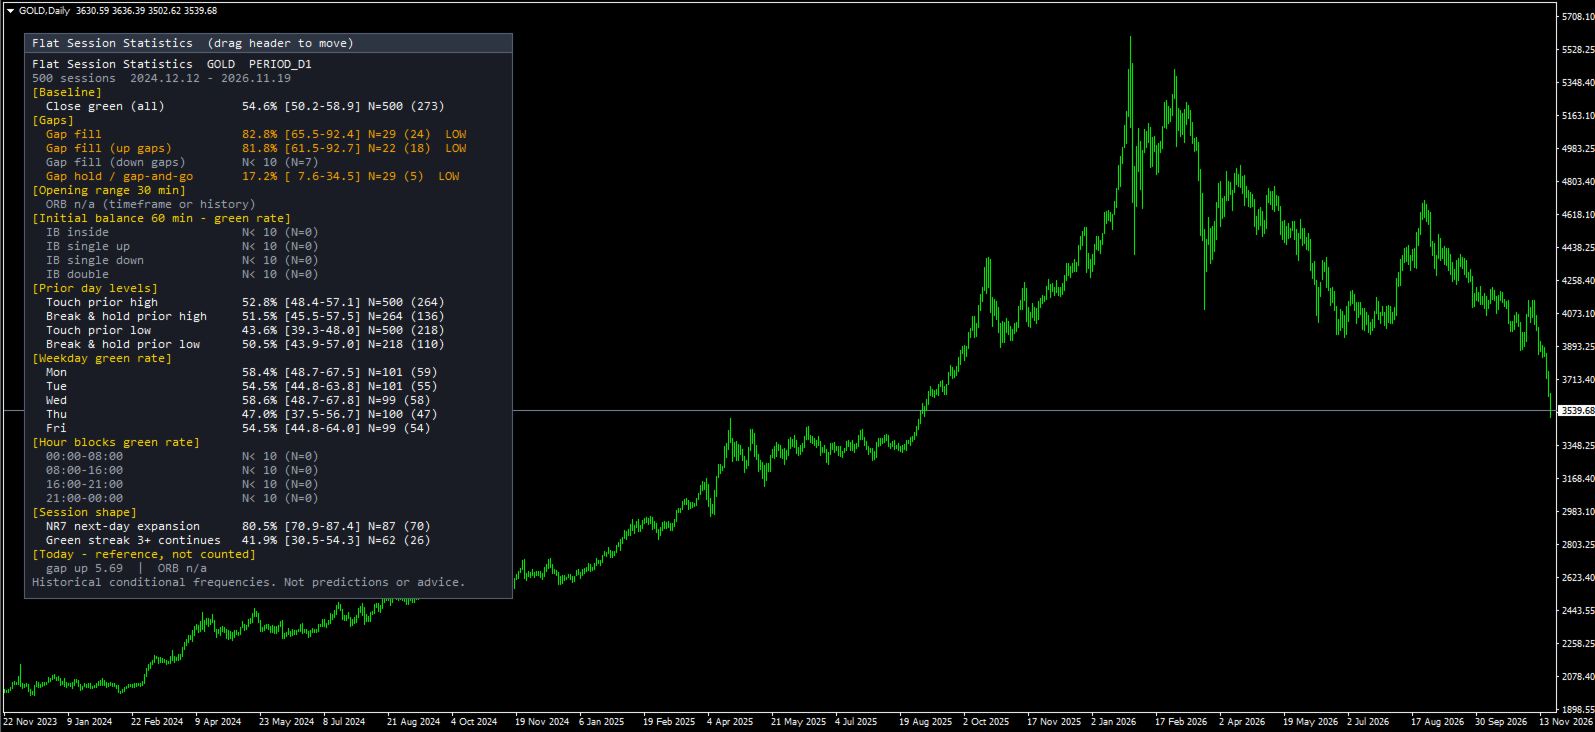
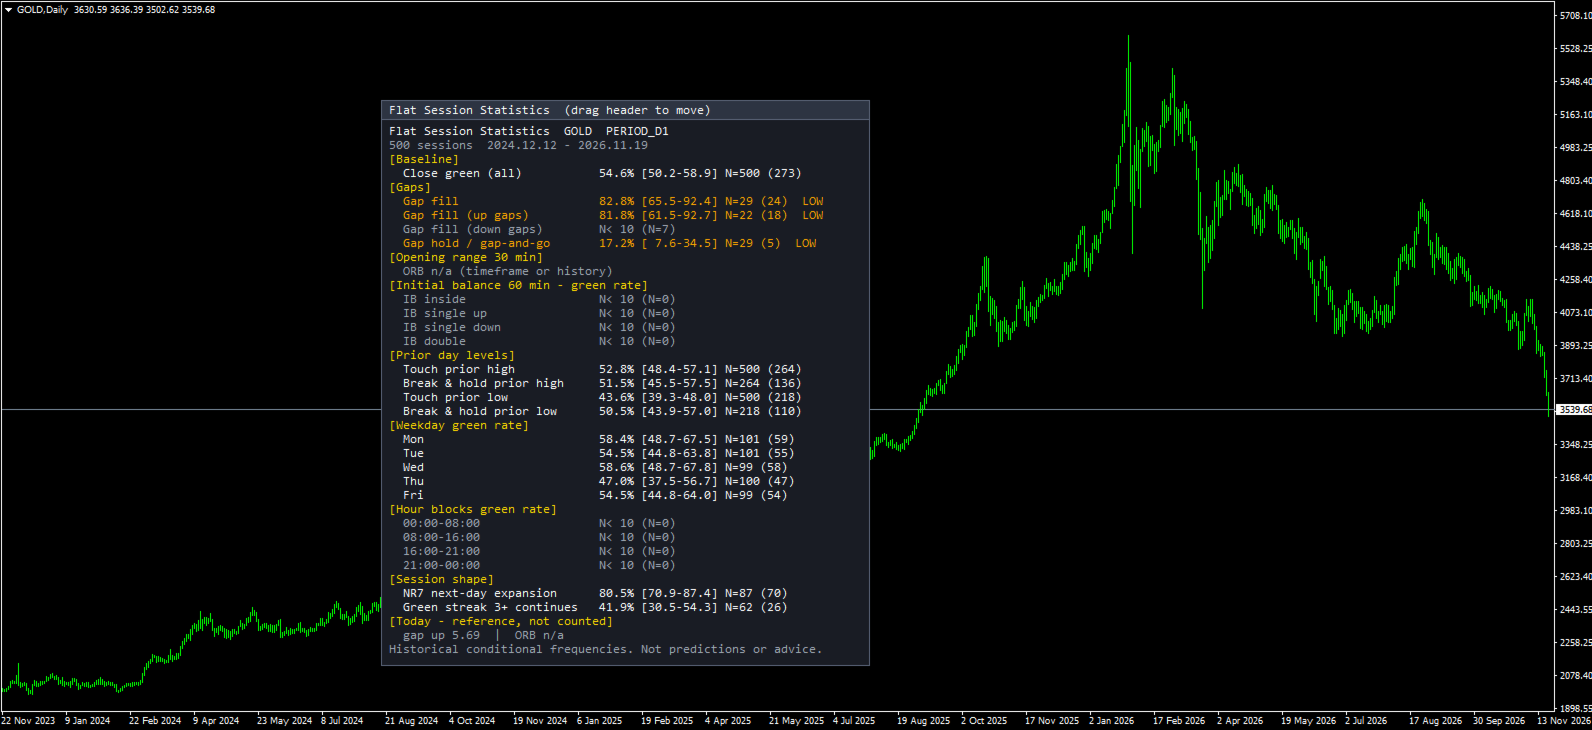
Flat Session Statistics is a statistics panel for MetaTrader 4. It does not generate buy or sell signals. It aggregates the past bars of the symbol it is attached to and shows how often a defined event was followed by a defined outcome — as a conditional frequency with its sample size (N) and a Wilson 95% confidence interval on every line.

Statistics (14 items, closed sessions only):
- Baseline green rate (sessions closing above their open)
- Gap fill rate (all / up / down) and gap-and-go hold rate
- Opening range (default 30 min): break rate, false-break rate, 1R / 2R target hit rates
- Initial balance (default 60 min): green rate by break type (inside / single up / single down / double) with share
- Prior day high / low: touch rate and break-and-hold rate
- Seasonality: green rate by weekday and by hour block
- NR7 next-day expansion rate; green-streak (3+) continuation rate

Statistical honesty by design: estimates below N=10 are withheld (count only), rows below N=30 carry a LOW SAMPLE warning, and no percentage is ever shown without its N and interval. The forming session is never counted; it is shown separately as reference only. All outcomes are judged on closed bars of their own session — no future reference, no repainting of statistics.

The panel can be dragged to any position; the position is stored per symbol and timeframe. Session definition: server calendar day by default, or a custom session start hour. Opening-range and initial-balance windows are anchored to the first bar of the session, so symbols with a daily trading break are handled correctly.

Recommended timeframes: M1–M30 (opening-range and initial-balance items require intraday bars). Works on any symbol. No orders are placed; this is a display-only indicator.

Note for MetaTrader 4: the number of sessions that can be aggregated is limited by the "Max bars in history" and "Max bars in chart" settings under Tools → Options → Charts. For example, 500 sessions on M15 require roughly 48,000 or more bars of history.

Disclaimer: This product displays historical conditional frequencies computed from your broker's price data. It is not a prediction, not investment advice, and does not guarantee any future result or profit. Results differ by broker, account type and symbol. Trading involves risk; decisions are your own responsibility.

License note: The calculation design follows the concepts of LuxAlgo "edge-stats" (MIT License, Copyright (c) 2026 LuxAlgo Global, LLC), independently re-implemented for MT4. No original code is used.
Produits recommandés
Product Overview Global Session Zones System is a chart indicator designed for both   MT4 and MT5   platforms. It visualizes the four major global trading sessions (New York, London, Tokyo, Sydney) by drawing session background boxes, key price levels, and a statistical panel. It helps traders identify market volatility and trend strength, providing reliable breakout signals. Core Features Session Visualization : Customizable start/end times and colors for the four major sessions. Technical Anal
Ichimoku Strength Meter MT4   is a professional multi-timeframe indicator for MetaTrader 5 that combines currency strength, pair recommendations, Ichimoku trend direction and moving average bias in a clear dashboard. The indicator analyzes the 8 most important currencies: USD, EUR, GBP, JPY, CHF, AUD, CAD and NZD From this, all 28 major currency pairs are automatically calculated and evaluated according to strength, trend direction and signal quality. Main functions Multi-timeframe currency stre
The indicator detects and displays Shark harmonic pattern (see the screenshot). The pattern is plotted by the extreme values of the ZigZag indicator (included in the resources, no need to install). After detecting the pattern, the indicator notifies of that by a pop-up window, a mobile notification and an email. The indicator highlights the process of the pattern formation and not just the complete pattern. In the former case, it is displayed in the contour triangles. After the pattern is comple
This indicator is one of the useful tools for traders who trade on currency pairs and based on the strength of each currency they can make a correct decision or confirmation in the positions.  It has been calculated for all the minor currency pairs supported by the broker and displays the values of the major currencies. These currencies are displayed horizontally or vertically according to the trader's config when executing the indicator. One of the trading strategies that can be used is to cho
FREE
The Standard Deviation (StdDev) indicator drawn using a tick chart. After launching it, wait for enough ticks to come. Parameters: Period - period of averaging. Method - method of averaging. calculated bar - number of bars for the indicator calculation.
"Auto FIBO Pro" Crypto_Forex indicator - est un excellent outil auxiliaire dans le trading ! - L'indicateur calcule et place automatiquement sur le graphique les niveaux de Fibo et les lignes de tendance locales (couleur rouge). - Les niveaux de Fibonacci indiquent les zones clés où le prix peut s'inverser. - Les niveaux les plus importants sont 23,6 %, 38,2 %, 50 % et 61,8 %. - Vous pouvez l'utiliser pour le scalping inversé ou pour le trading en grille de zones. - Il existe également de nombr
Rira Renko
Vitor Palmeira Abbehusen
RENKO on Time Chart This indicator is an enhanced Renko, so you can watch the Renko bricks on the chart to understand price movement more clearly the other improvement is automated box size according to ATR (Average True Range) period you can set the ATR number as you want and the box size of Renko changes automatically based on price movement Inputs Mode: Box size is the input to specify the size of the Renko box you want to print on the chart. This input lets you choose the fixed box siz
RSI Parabolic Overbought Oversold Multi pair Timeframe Scanner 1. Overview - RSI Parabolic Scanner Dashboard is a multi-symbol, multi-timeframe technical analysis indicator and real-time market scanner engineered for MetaTrader 4 (MT4). - It continuously monitors user-defined currency pairs, metals, or visible Market Watch instruments across multiple chart timeframes to identify momentum reversals and overbought or oversold market conditions. - The indicator combines two selectable RSI-based si
Unlock hidden profits: accurate divergence trading for all markets Tricky to find and scarce in frequency, divergences are one of the most reliable trading scenarios. This indicator finds and scans for regular and hidden divergences automatically using your favourite oscillator. [ Installation Guide | Update Guide | Troubleshooting | FAQ | All Products ] Easy to trade Finds regular and hidden divergences Supports many well known oscillators Implements trading signals based on breakouts Display
RQL Trend Board – Description RQL Trend Board   is a simple but powerful multi-timeframe trend dashboard. It shows the current market bias across several timeframes at the same time, using an internal trend-classification method. Each timeframe is displayed as a colored box:   Green   – bullish bias → look for   long   setups   Yellow   – ranging / unclear →   no trade zone   Red   – bearish bias → look for   short   setups The indicator gives a clear   overall picture   of where the
FREE
Based on the trend of more empty line. At present is version 1.03, with new later. Appear more prompt, can open more than single Empty message, can open an empty list The discoloration of three counties, represent different levels of  The market at present there is an organization - the sea education, they are also more empty lines, but I more empty line is based on their changes, on the basis of identifying trend more accurately. Trad duokong line is an automatic identification of long-short t
SymbolsSwich
Oleksii Novykov
Symbol Syncyro Switch - is a utility that allows you to switch a trading symbol on several charts at the same time. If you use several charts of the same symbol with different timeframes for analysis and want to change the symbol of a trading instrument, then this tool is just for you! With one click on the button with the inscription of the trading symbol, you can easily change it using this utility.
Индикатор виртуального эквити, представляемый здесь, может работать по нескольким символам одновременно. Для каждого символа задается направление ( Buy/Sell ) и размер позиции. В настройках также указывается размер предполагаемого депозита, дата открытия и закрытия позиции.   На графике при этом устанавливаются вертикальные линии, обозначающие указываемые в настройках даты.  После установки индикатора на график, можно изменять время открытия и закрытия позиции, передвигая эти линии.   Дату закр
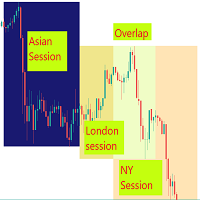
Visual guide which divides the 24 hours into three trading sessions. The default setting is to show   Asian ,   London   and   New York   sessions. But, the session start and end hours can be adjusted as required.  The indicator is useful to develop trading strategies by making it easy to see the market behavior during the three sessions.  Inputs Time Zone Start and End hours (Please provide values in HH:MM format, like 02:00, not like 2:00. Both the hours and minutes should have 2 digits) Ti
Gold Buster M1 System est un système de trading professionnel pour les graphiques M1 sur la paire XAUUSD. Mais, malgré le fait que le système a été développé à l'origine exclusivement pour le commerce de l'or, le système peut également être utilisé avec d'autres paires de devises. Après l'achat, je vous donnerai une liste de paires de trading pouvant être utilisées avec le système en plus de XAUUSD, ce qui élargira vos possibilités d'utilisation de ce système. TOUS LES INDICATEURS DU SYSTÈME NE
This is a multi-timeframe candle patterns indicator. It scans the chart for Hammer , Engulfing candle , Doji candle and Three white soldiers / black crows setups. FEATURES: Main panel showing timeframe s from M5 - W1, last signal and last signal time of the selected candle pattern. You can switch between the timeframes by clicking on them. A panel with buttons to switch from one candle pattern to another on the main panel. Arrows to help you locate the candle pattern. A scale showing you what ca
The AX Forex Indicator MT4 is a sophisticated trading tool designed to provide traders with a comprehensive analysis of multiple currency pairs. This   powerful indicator   simplifies the complex nature of the forex market, making it accessible for both novice and experienced traders. AX Forex Indicator uses   advanced algorithms   to detect trends, patterns and is an essential tool for traders aiming to enhance their forex trading performance. With its robust features, ease of use, and reliabl
Trend Ray
Andriy Sydoruk
The indicator shows the potential trend direction by cyclical-wave dependence. Thus, all the rays of the intersection will be optimal rays, in the direction of which the price is expected to move, taking into account the indicator period. Rays can be used as a direction for potential market movement. But we must not forget that the approach must be comprehensive, the indicator signals require additional information to enter the market.
Trend PA
Mikhail Nazarenko
5 (3)
The Trend PA indicator uses   Price Action   and its own filtering algorithm to determine the trend. This approach helps to accurately determine entry points and the current trend on any timeframe. The indicator uses its own algorithm for analyzing price changes and Price Action. Which gives you the advantage of recognizing, without delay, a new nascent trend with fewer false positives. Trend filtering conditions can be selected in the settings individually for your trading style. The indicator
This EA is an extension for the free trade indicator Trend Mate . https://www.mql5.com/en/market/product/50082 The main idea is to support your decision to  trade  according to the current trend. It is possible to configure alert and push notification to receive when entering to first candle for bull / bear trend. For this extension of the free indicator now it is possible to filter the current trend info with other timeframes. For example show trend for timeframe M5 considering also timeframe
L'Indice Directionnel Moyen (ADX) Scanner Multidevises MT4 est un indicateur de trading avancé conçu pour analyser plusieurs paires de devises simultanément. Il bénéficie aux traders cherchant à améliorer leur processus de prise de décision en fournissant des signaux en temps réel basés sur l'Indice Directionnel Moyen, permettant une analyse efficace des tendances du marché. Cet outil simplifie l'expérience de trading en facilitant l'identification de la force des tendances et du mouvement direc
ZoneDominator AI
Mohammad Ziad Abdelwahed Alkahlah
ZoneDominator AI — Adaptive Multi-Timeframe Support & Resistance Indicator Overview ZoneDominator AI is an advanced analytical indicator that continuously scans all timeframes to locate the most accurate and relevant Support & Resistance zones. It uses a unique combination of ATR volatility, Moving Averages, Price Action, and higher-timeframe confirmation to adapt in real time to market structure. You can choose your preferred trading style — Scalping, Intraday, or Swing — and the indicat
The indicator detects and displays 3 Drives harmonic pattern (see the screenshot). The pattern is plotted by the extreme values of the ZigZag indicator (included in the resources, no need to install). After detecting the pattern, the indicator notifies of that by a pop-up window, a mobile notification and an email. The indicator highlights the process of the pattern formation and not just the complete pattern. In the former case, it is displayed in the contour triangles. After the pattern is com
Quantum Falcon Signal Free is a smart visual trading indicator for MetaTrader 4 designed for Forex and Gold traders. The indicator combines: • Trend analysis • RSI momentum confirmation • MACD momentum filtering • ATR volatility filtering • Higher timeframe confirmation • Smart exit signal detection Main Features: • Smart Buy and Sell signals • Exit Buy / Exit Sell alerts • Real-time dashboard on chart • Professional candle arrows • Multi-timeframe trend confirmation • ATR market volatility filt
FREE
Présentation du Big Move Indicator MT4, un outil puissant conçu pour mettre en évidence les mouvements de prix significatifs sur vos graphiques de trading. Cet indicateur est parfait pour les traders cherchant à tirer parti des changements de momentum forts et des variations de volatilité sur le marché. Avec la capacité de marquer visuellement de grands mouvements de prix, le Big Move Indicator MT4 aide les traders à identifier rapidement des opportunités de trading à fort impact, permettant des
AutoPivot
Hafis Mohamed Yacine
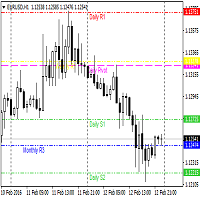
This indicator will draw monthly, weekly, and daily pivot. Pivot line will be calculated automatically again when the period ends. Auto Pivot Metatrader 4 Indicator The Auto Pivot indicator for Metatrader 4 automatically updates the pivot point (PP), support (S1,S2,S3) and resistance levels (r1,r2,r3) every day. Price above the pivot point means positive while price below the pivot point means negative. S3 indicates extremely oversold while price above resistance r3 means extremely overbought.
Master Dot for MetaTrader 4 Detect Volatility Exhaustion Before the Market Returns to Balance Master Dot is a professional non-repainting indicator designed to detect moments when price moves beyond its statistically expected volatility range. These situations often occur during sharp market impulses, liquidity grabs or temporary emotional moves, when price departs from its normal trading conditions. Instead of following trends, Master Dot highlights volatility exhaustion — moments where the mar
MajorAlert
Sergei Vassunov
MajorAlert - is a professional trading indicator for MetaTrader 4 that combines two distinct market analysis approaches into one powerful tool. By integrating a counter‑trend entry logic (upper block) with a trend‑following filter (lower block), the indicator generates high‑probability signals on the chart with clearly separated arrow colors. Key Features Fully self‑contained   – no external indicators required; all calculations are built‑in. Versatile inputs   – adjust all parameters to suit a
Price Magnet — Price Density and Attraction Levels Indicator Price Magnet is a professional analytical tool designed to identify key support and resistance levels based on statistical Price Density. The indicator analyzes a specified historical period and detects price levels where the market spent the most time. These zones act as “magnets,” attracting price action or forming a structural base for potential reversals. Unlike traditional Volume Profile tools, Price Magnet focuses on price-time d
Indicator for binary options arrow is easy to use and does not require configuration works on all currency pairs, cryptocurrencies buy signal blue up arrow sell signal red down arrow tips do not trade during news and 15-30 minutes before their release, as the market is too volatile and there is a lot of noise it is worth entering trades one or two candles from the current period (recommended for 1 candle) timeframe up to m 15 recommended money management fixed lot or fixed percentage of the depo
Les acheteurs de ce produit ont également acheté
Currency Strength Wizard est un indicateur très puissant qui vous offre une solution tout-en-un pour un trading réussi. L'indicateur calcule la puissance de telle ou telle paire de devises en utilisant les données de toutes les devises sur plusieurs périodes. Ces données sont représentées sous la forme d'un indice de devise facile à utiliser et de lignes électriques de devise que vous pouvez utiliser pour voir la puissance de telle ou telle devise. Tout ce dont vous avez besoin est d'attacher l'
Trend SniperX MT4
Sarvarbek Abduvoxobov
5 (6)
Trend Sniper X est un indicateur de suivi de tendance multi-temporalité pour MetaTrader 5 qui aide les traders à identifier la direction de la tendance et les points de retournement potentiels avec clarté et précision. Pour MT5 : https://www.mql5.com/en/market/product/181101 Information sur le prix : Le prix actuel est une offre promotionnelle et peut évoluer au fur et à mesure de la sortie des prochaines mises à jour et nouvelles fonctionnalités. Canal Code2Profit Maîtrisez le marché grâce à l'
M1 Sniper
Oleg Rodin
4.97 (30)
M1 SNIPER est un système d'indicateurs de trading facile à utiliser. Il s'agit d'un indicateur à flèche conçu pour l'unité de temps M1. Cet indicateur peut être utilisé seul pour le scalping sur l'unité de temps M1 ou intégré à votre système de trading existant. Bien que conçu spécifiquement pour le trading sur l'unité de temps M1, ce système peut également être utilisé avec d'autres unités de temps. Initialement, j'avais conçu cette méthode pour le trading du XAUUSD et du BTCUSD. Cependant, je
Smart Trend Trading System est un indicateur pour MetaTrader 4 qui réunit les informations de tendance, les signaux d’entrée et de sortie et les niveaux de prix sur un même graphique. Il combine plus de 10 outils de trading en un seul système, incluant la détection de tendance, les zones de retournement, Smart Cloud, la logique de trailing stop, le support et la résistance, la coloration des bougies, les alertes et l’analyse multi-timeframe. Le système est conçu pour vous aider à trader différen
SIO Oscillator : oscillateur auto-optimisé de déséquilibre de semi-variance Achetez l’indicateur et recevez GRATUITEMENT l’Expert Advisor (EA) basé sur celui-ci. La plupart des oscillateurs traitent tous les mouvements de prix de la même manière. SIO sépare la pression haussière de la pression baissière et mesure le déséquilibre entre les deux, montrant quel camp contrôle réellement le marché : les acheteurs ou les vendeurs. Lorsque le déséquilibre atteint un extrême, SIO génère un signal clair
Liquidity Scalper System : un système de trading basé sur la liquidité au format indicateur. La plupart des indicateurs n'affichent qu'une flèche, puis le trader décide seul où placer le stop, où se trouve l'objectif et s'il peut faire confiance au signal. Liquidity Scalper System couvre tout le cycle du trade : il trouve les pools de liquidité, donne un signal lors de leur cassure, calcule immédiatement Entry, Stop Loss et trois objectifs, et affiche sur le panneau les statistiques et les résu
Gann Made Easy
Oleg Rodin
4.84 (174)
Gann Made Easy est un système de trading Forex professionnel et facile à utiliser qui est basé sur les meilleurs principes de trading en utilisant la théorie de mr. WD Gann. L'indicateur fournit des signaux d'ACHAT et de VENTE précis, y compris les niveaux Stop Loss et Take Profit. Vous pouvez échanger même en déplacement en utilisant les notifications PUSH. VEUILLEZ ME CONTACTER APRÈS L'ACHAT POUR RECEVOIR GRATUITEMENT DES INSTRUCTIONS DE TRADING ET D'EXCELLENTS INDICATEURS SUPPLÉMENTAIRES! Vou
Advanced Supply Demand
Bernhard Schweigert
4.91 (302)
Offre spéciale : 30 % de réduction La solution idéale pour les traders débutants comme experts ! Cet indicateur est un outil de trading unique, performant et abordable grâce à l’intégration de nombreuses fonctionnalités exclusives et d’une nouvelle formule. Cette mise à jour vous permet d’afficher des zones sur deux unités de temps. Vous pourrez ainsi visualiser non seulement une unité de temps supérieure, mais aussi l’unité de temps du graphique, ainsi que l’unité de temps supérieure : des z
Cet indicateur est un indicateur d'analyse automatique des vagues, parfait pour le trading pratique ! Cas... Remarque :   je n'ai pas l'habitude d'utiliser des noms occidentaux pour l'évaluation des vagues. En raison de l'influence de la convention de dénomination de Tang Lun (Tang Zhong Shuo Zen), j'ai nommé la vague de base comme   un stylo   et la bande d'onde secondaire comme   un segment   . en même temps, le segment a la direction de la tendance.Le   segment de tendance principal   est no
Actuellement 30% de réduction ! La meilleure solution pour tout débutant ou trader expert ! Ce logiciel de tableau de bord fonctionne sur 28 paires de devises. Il est basé sur 2 de nos principaux indicateurs (Advanced Currency Strength 28 et Advanced Currency Impulse). Il donne un excellent aperçu de l'ensemble du marché Forex. Il montre les valeurs de l'Advanced Currency Strength, la vitesse de mouvement des devises et les signaux pour 28 paires de devises dans tous les (9) délais. Imaginez
Non repaint MT4
Yan Zhen Du
5 (2)
This is a professional chart indicator designed for traders focused on stability and clear price action. It helps filter market noise and provides clear visual entry and exit zones for your trading decisions. Price Information: The current price is promotional and is subject to change as upcoming updates and new features are released. MQL5 public channel:  CLICK HERE for MT5:  Non-repainting MT5 version Core Features: Strictly Non-Repainting: The system is built with strict non-repaint logic. W
Scalper Vault
Oleg Rodin
4.9 (41)
Scalper Vault est un système de trading puissant et complet, conçu pour les traders en quête de régularité dans le cadre du trading intrajournalier. Cet indicateur de haute précision constitue un système de trading autonome et exhaustif, offrant des analyses de qualité institutionnelle, aussi bien pour le Forex que pour les options binaires. VEUILLEZ ME CONTACTER APRÈS VOTRE ACHAT POUR OBTENIR MES CONSEILS DE TRADING AINSI QU'UN EXCELLENT BONUS ! En éliminant les incertitudes et les analyses ma
Nous vous présentons ON Trade Waves Patterns Harmonic Elliot Wolfe, un indicateur avancé conçu pour détecter divers types de schémas sur le marché à l'aide de méthodes manuelles et automatiques. Voici comment il fonctionne : Schémas Harmoniques : Cet indicateur peut identifier les schémas harmoniques qui apparaissent sur votre graphique. Ces schémas sont essentiels pour les traders qui pratiquent la théorie du trading harmonique, telle qu'elle est décrite dans le livre de Scott Carney "Harmonic
RFI levels PRO
Roman Podpora
5 (2)
L'indicateur montre avec précision les points de retournement et les zones de retour des prix où le       Acteurs majeurs   . Vous repérez les nouvelles tendances et prenez des décisions avec une précision maximale, en gardant le contrôle de chaque transaction. VERSION MT5     -     Révèle son potentiel maximal lorsqu'il est combiné à l'indicateur   TREND LINES PRO Ce que l'indicateur montre : Structures et niveaux d'inversion avec activation au début d'une nouvelle tendance. Affichage des nive
Zoryk Gold mt4
Reda El Koutbane
5 (4)
ZORYK — Système avancé de signaux et de planification pour XAUUSD sur MetaTrader 4 Vous connaissez probablement cette situation. Vous analysez l’or, attendez l’entrée, puis ouvrez enfin la position. Le prix part immédiatement contre vous. Vous fermez trop tôt, déplacez le Stop Loss ou hésitez quelques secondes. Peu après, le marché atteint exactement la direction et l’objectif que vous aviez prévus, mais sans vous. Le problème n’était pas toujours la direction. Le véritable problème était l
ShapeRadar - indicateur de figures chartistes classiques ShapeRadar repère automatiquement sur le graphique les figures classiques de l’analyse technique : doubles et triples sommets et creux, tête et épaules et sa version inversée, biseaux ascendants et descendants, rectangles, triangles, drapeaux et fanions. Lorsque le prix clôture au-delà de la limite d’une figure, l’indicateur trace la figure, le point d’entrée, le niveau de stop loss et l’objectif, et un panneau d’information résume toutes
Le système PRO Renko est un système de trading très précis spécialement conçu pour le trading de graphiques RENKO. Il s'agit d'un système universel qui peut être appliqué à divers instruments de négociation. Le système neutralise efficacement ce qu'on appelle le bruit du marché en vous donnant accès à des signaux d'inversion précis. L'indicateur est très facile à utiliser et n'a qu'un seul paramètre responsable de la génération du signal. Vous pouvez facilement adapter l'outil à n'importe que
SR Liquidity
Oleg Rodin
5 (3)
SR Liquidity est un indicateur de trading conçu pour révéler les zones cachées où se concentre la liquidité du marché et où le prix réagit avec le plus d'intensité. Ces zones de liquidité spécifiques agissent comme de puissants niveaux de support et de résistance, vous offrant une cartographie claire des points où le marché est le plus susceptible de se retourner. Plutôt que de tracer des lignes de support et de résistance classiques, l'indicateur SR Liquidity analyse le comportement réel des pr
Auto Optimized SpeedAngle est un système de vectorisation du momentum de niveau institutionnel qui élimine l'ajustement de courbe ( curve-fitting ) grâce à une optimisation continue par avancement ( Walk-Forward Optimization , WFO). Plutôt que de s'appuyer sur des entrées statiques qui se dégradent lorsque les régimes de marché changent, l'indicateur recalibre dynamiquement ses paramètres en utilisant une validation hors échantillon ( Out-of-Sample , OOS), garantissant ainsi que les signaux affi
Professional Volume Profile An indicator for MetaTrader 4 that builds a horizontal Volume Profile directly on the price chart. It shows the levels where traders executed the most trades, helping to identify support/resistance zones and assess the balance of power in the market. What the Indicator Displays POC (Point of Control) — the level with the maximum trading volume (red line). VAH / VAL (Value Area High / Low) — the upper and lower boundaries of the value area, where 70% of the volume was
Italo Volume Indicator
Italo Santana Gomes
4.92 (79)
BUY INDICATOR AND GET EA FOR FREE AS A BONUS + SOME OTHER GIFTS! ITALO VOLUME INDICATOR  is the best volume indicator ever created, and why is that? The Indicator works on all time-frames and assets, indicator built after 7 years of experience on forex and many other markets. You know many volume indicators around the internet are not complete, does not help, and it's difficult to trade, but the Italo Volume Indicator is different , the Italo Volume Indicator shows the wave volume, when market
Il estime le mouvement de prix le plus probable à court terme à partir de calculs mathématiques avancés. Caractéristiques Estimation du mouvement immédiat du prix sur l'unité de temps du graphique et sur toutes les unités supérieures ; Calcul de la tendance réelle du marché ; Calcul des niveaux de support et de résistance les plus importants ; Alertes sur les zones de congestion, les croisements de niveaux et les changements de tendance ; Léger pour les ressources du système : les lignes et le
Atomic Analyst
Issam Kassas
5 (14)
Atomic Analyst — MetaTrader 4 Pour toute question sur le produit, sa configuration ou le support technique, envoyez-moi un message directement ici sur MQL5. L’indicateur transforme des calculs complexes du marché en signaux visuels simples, bougies colorées, lectures de tendance, niveaux de stop-loss et plusieurs zones de take-profit que les traders peuvent comprendre rapidement et utiliser dans des conditions réelles de marché. Principales utilisations de trading : Scalping et trading intraday
Scalping Entry Points - est un système de trading manuel qui peut s'adapter aux mouvements de prix et donner des signaux pour ouvrir des trades sans redessiner. L'indicateur détermine la direction de la tendance par le niveau central de support et de résistance. L'indicateur de point fournit des signaux pour les entrées et les sorties. Convient pour le trading intrajournalier manuel, le scalping et les options binaires. Fonctionne sur tous les délais et instruments de trading. L'indicateur donne
All in One package includes the  Oscillator Predictor ,  MACD Predictor ,  Thrust Scanner  and  Advanced Fibonacci  indicators which are mandatory for applying  Dinapoli  trade plans.  Please visit below links for detailed explanations of indicators. Advanced Fibonacci Indicator =>  https://www.mql5.com/en/market/product/52834 Thrust Scanner Indicator => https://www.mql5.com/en/market/product/52830 Overbought /Oversold Predictor indicator => https://www.mql5.com/en/market/product/52621 Macd P
True Direction Oscillator
Muhammad Elbermawi
4.85 (364)
Ou (TDO) qui est un indice qui mesure le taux de variation des prix en utilisant le principe du « Pure Momentum ». Lorsque le prix d'un titre augmente de 10 à 15, le taux de variation du prix est de 150 %, mais lorsqu'il redescend de 15 à 10, le taux de variation du prix n'est que de 33,3 %. C'est pourquoi les indicateurs d'analyse technique tels que « Taux de variation des prix » (ROC) ou « Momentum » donnent des lectures plus élevées pour les mouvements de prix ascendants que ceux donnés aux m
Quantum Imbalance Profiles   est un indicateur des phases d'équilibre et de déséquilibre. Il montre à quels prix le marché a échangé du volume, quel camp a dominé dans cette zone et à travers quels niveaux le prix s'est ensuite étendu par impulsion. Un profil de volume classique répond à une seule question : où les échanges ont eu lieu. Il ne montre pas quel camp a dominé à chaque prix, comment la consolidation s'est terminée ni dans quelle direction le marché en est sorti. Quantum Imbalance Pro
Indicateur de trading manuel et d'analyse technique pour le Forex. Il se compose d'un indicateur de tendance avec le niveau d'ouverture du jour de bourse et d'un indicateur de flèche pour déterminer les points d'entrée. L'indicateur ne se recolore pas ; il fonctionne lorsque la bougie se ferme. Contient plusieurs types d'alertes pour les flèches de signalisation. Peut être configuré pour fonctionner sur n’importe quel graphique, instrument de trading ou période. La stratégie de travail est bas
Currency Strength Matrix
Raymond Gilmour
4.5 (26)
THE ONLY CURRENCY STRENGTH INDICATOR BUILT ON PRICE ACTION Most currency strength meters average an oscillator, or measure how far price has travelled. But these are not accurate measures of trend, Currency Strength Matrix measures trend strength, not just if a currency price has gone up or down. Currency Strength Matrix reads market structure . For each of the 28 major pairs it finds the confirmed cycle highs and lows, and decides whether that pair is in an uptrend, a downtrend, or neither. A
Dark Support Resistance  is an Indicator for intraday trading. This Indicator is programmed to identify  Support and Resistance Lines , providing a high level of accuracy and reliability. Key benefits Easily visible lines Only the most important levels will be displayed Automated adjustment for each timeframe and instrument Easy to use even for beginners Never repaints, never backpaints, Not Lag 100% compatible with Expert Advisor development All types of alerts available: Pop-up, Email, Push
Plus de l'auteur
Flat Flag Patterns automatically detects and draws flag and pennant continuation patterns on your MT4 chart. It looks for a strong one-way move (the pole) followed by a small consolidation (the flag), and draws the pole line, the flag zone, a label and arrows directly on the chart. Detection is normalised by volatility (ATR), so the same yardstick applies across symbols and timeframes. For the pole it also checks that the move was clean and one-directional — choppy two-way action does not count
Flat SMC Structure Map is a Smart Money Concepts structure indicator for MetaTrader 4. It draws the market structure on one chart: BOS / CHoCH, order blocks, FVGs, liquidity lines (EQH / EQL) and sweeps, and premium / discount positioning — all judged on closed bars only, so confirmed drawings never repaint. Structure: two layers — major swings (default left/right 5) for the main flow and internal swings (default 2) for the short-term flow, each labelled HH / HL / LH / LL. A close break in the t
Horizon Quad-Compass MT4 — 4 indicators x 3 timeframes x up to 12 symbols on one dashboard Horizon Quad-Compass is a multi-timeframe, multi-symbol monitoring indicator for MetaTrader 4. It reads four widely used indicators — MA, Stochastic, MACD and ADX — on three timeframes for up to 12 symbols at once, and shows each symbol's direction as dots on a single dashboard, so you can see which symbols are aligned and which timeframe is breaking down without switching between charts. Direction at a gl
Overview FlatStochasticCycle is a signal indicator for MetaTrader 4 that reads three Stochastics with different periods as overlapping "cycles". A cross of the short Stochastic is the trigger, and the mid and long Stochastics (position against level 50) filter the situation. OsMA checks momentum and ADX checks trend strength; each filter can be switched ON/OFF individually. All judgements are made on closed bars, so signals do not repaint. This indicator does not place orders by itself. Main fea
Overview Flat10-Trend Bias Panel is a multi-symbol bias monitor for MetaTrader 5. It watches 9 symbols (EURUSD, GBPUSD, USDJPY, AUDUSD, NZDUSD, USDCAD, USDCHF, EURJPY and GOLD) and judges the trend bias of each symbol from four technical votes: moving average alignment, ADX, MACD and RSI. When all four votes agree, the symbol is treated as having a strong bias. The panel also draws entry-timing arrows for the chart symbol. This indicator does not place orders by itself. Main features Each watche
Overview FlatAutoFibonacci is an automatic Fibonacci indicator for MetaTrader 5. It detects swing highs and lows and draws Fibonacci retracement levels automatically, and in addition it watches for reversal bars near the levels and draws counter-trend entry signals. A second Fibonacci projection provides take-profit and stop-loss reference lines, and a statistics panel shows a win-rate simulation of the signals. This indicator does not place orders by itself. Main features Fibonacci retracement
Overview FlatFibonacciWave is a two-stage Fibonacci indicator for MetaTrader 5. It detects the latest swing and draws two-stage Fibonacci levels automatically, with a price table and a movable dashboard. In addition to the level display, it provides linkage event buffers and alerts when price reaches a level. This indicator does not place orders by itself. Main features Two-stage Fibonacci levels are drawn automatically from the detected swing Linkage event buffers for external tools (buffer 2 =
Overview FlatFibonacciCluster is a multi-timeframe Fibonacci overlap map for MetaTrader 5. It draws Fibonacci retracement levels from six timeframes (M15, M30, H1, H4, D1 and W1) on one chart, and highlights the price bands where levels from different timeframes overlap within a tolerance. The more levels overlap in a band, the more timeframes share a level near that price. This indicator does not place orders by itself. Main features Levels are drawn as bands, and each band's end label shows it
Overview FlatStochasticCycle is a signal indicator for MetaTrader 5 that reads three Stochastics with different periods as overlapping "cycles". A cross of the short Stochastic is the trigger, and the mid and long Stochastics (position against level 50) filter the situation. OsMA checks momentum and ADX checks trend strength; each filter can be switched ON/OFF individually. All judgements are made on closed bars, so signals do not repaint. This indicator does not place orders by itself. Main fea
Horizon Trend Matrix is a matrix-style dashboard indicator for MetaTrader 5. It judges the trend of one symbol across three timeframes (H1, M15, M5) using a single selectable moving average method, and shows the result as a compact matrix together with signal arrows on the chart. Main features 12 moving average types to choose from, including SMA, EMA, RMA and ALMA Each dashboard cell shows the deviation rate (%) of the price from the moving average, color-coded by direction Signal arrows appear
Overview Horizon MACD Radar is a radar-style dashboard indicator for MetaTrader 5. It monitors MACD-based signals across multiple symbols and timeframes at a glance, and shows signal arrows on the chart so you can spot where momentum is turning without opening many charts. Main features Signal mode can be switched from the parameters: MACD cross mode or OsMA mode The selected mode is saved per chart and shown on the dashboard All signals are evaluated on closed bars only, so displayed signals do
Overview Horizon Quad-Compass is a compass-style dashboard indicator for MetaTrader 5. For each symbol, it lays out four oscillators (moving average, stochastic, MACD and ADX) against three timeframes (H1, M15 and M5) as a grid of dots in a subwindow, so trend and momentum conditions can be compared at a glance. Main features Dashboard in a subwindow: rows are the four oscillators (MA, Stochastic, MACD, ADX) and columns are the timeframes (H1, M15, M5) Clicking a timeframe header button opens th
Overview Horizon Pulse is a multi-symbol matrix dashboard indicator for MetaTrader 5. It watches up to 40 symbols across 4 timeframes in a single matrix, and also ranks the strength of the 8 major currencies numerically, so you can grasp the whole market's direction from one panel. Main features Matrix view of up to 40 symbols x 4 timeframes Currency strength ranking for the 8 major currencies, shown as numeric values Signal Mode can be selected from the parameters: MA Order or MACD Cross All ev
Overview Horizon Prime Consensus is a consensus-style dashboard indicator for MetaTrader 5. It combines the judgments of multiple technical indicators into one consensus view for each symbol across three timeframes (M5, M15 and H1), and draws signal arrows on the main price chart when the consensus points to an entry direction. Main features Consensus view across three timeframes: M5, M15 and H1 Signal arrows are drawn on the main price chart, not only inside the panel Signal mode can be selecte
Overview Horizon Expanded Signal is an entry signal indicator for MetaTrader 5. It checks whether five technical indicators (SMA, ADX, CCI, Parabolic SAR and Momentum) are aligned in the same direction, and only when the completed higher-timeframe trend agrees, it draws an entry signal together with suggested stop-loss and take-profit levels on the chart. It is designed and verified primarily for GOLD on the 15-minute timeframe. This indicator does not place orders by itself. Main features Align
Overview Horizon Combo Signal is an entry signal indicator for MetaTrader 5. It watches whether multiple technical conditions are aligned in the same direction, and when a new alignment is completed it draws an entry signal on the chart together with stop-loss and take-profit reference lines. The recommended setting is GOLD on the 1-hour timeframe. This indicator does not place orders by itself. Main features Entry arrows appear only when the alignment is newly completed, evaluated on closed bar
Four indicators. One agreement. One signal. Horizon Trend Combo Signal is a trend signal indicator built exclusively for GOLD (XAUUSD) on the H3 (180-minute) chart. It fires an entry signal only when all four of its components point in the same direction: Supertrend (factor 3.0, ATR 10) - trend direction Ichimoku Kinko Hyo (9, 26, 52) - price vs. cloud plus Tenkan/Kijun OsMA - MACD (12, 26, 9) histogram sign Aroon (14) - strength of the most recent high/low When the last component joins the othe
Horizon Agent Brief MT5 is a standalone indicator that briefs AI agents about the chart - and shows the same briefing to you on a movable panel. On every closed bar it writes a structured JSON packet to files (MQL5\Files\Horizon_Agent_Brief by default): the candle anatomy (body, wicks, close position, pattern), the last 5 candles, regime, momentum, volume, swing structure, previous-day levels and VWAP, the score breakdown and the tracked trade state. AI agents and external tools can read the pac
Flat Session Statistics is a statistics panel for MetaTrader 5. It does not generate buy or sell signals. It aggregates the past bars of the symbol it is attached to and shows how often a defined event was followed by a defined outcome — as a conditional frequency with its sample size (N) and a Wilson 95% confidence interval on every line. Statistics (14 items, closed sessions only): Baseline green rate (sessions closing above their open) Gap fill rate (all / up / down) and gap-and-go hold rate
Version 1.102 update: Added a fractal model (C2 / CISD / protected swings), Reclaim Strength (RS) with RS-band survival statistics in the panel, ICT killzones (5 sessions) with previous day/week/month pivots, and ADR/CDR. Each module can be switched on or off individually. The confluence signal (buffer 0 = Buy, 1 = Sell) and its readability from external tools such as Flat Manual Trader are unchanged. Flat SMC Structure Map is a Smart Money Concepts structure indicator for MetaTrader 5. It draws
Flat Volume Profile draws a volume profile on your MT5 chart from tick volume. For each period it builds a price-by-price volume histogram and shows: POC (Point of Control): the price with the highest volume Value Area (VAH / VAL): the range containing 70% of the period volume (adjustable) VWAP for the period, with optional +/-1SD and +/-2SD bands (latest profile) Period modes: Daily, Weekly, Rolling (last N bars) and Anchored (from any start time). Past profiles can be shown as well (default: 5
The signal, the sizing and the exit — in one EA. Horizon Trend Combo EA is a standalone expert advisor for MetaTrader 5, built exclusively for GOLD (XAUUSD) on the H3 (180-minute) chart. The Horizon Trend Combo signal is built into the EA itself: no separate indicator and no other product is required. How it trades The EA watches for the moment when four trend components agree in the same direction: - Supertrend (factor 3.0, ATR 10) — trend direction - Ichimoku Kinko Hyo (9, 26, 52) — price vs.
A standalone MT5 expert advisor for GOLD (XAUUSD) on M5. A regression-slope trend signal filtered by the higher-timeframe trend, long-only, with a 24-hour maximum hold and risk-% lot sizing. Verified on 100% real ticks over 2024-2026. One trend signal, one higher-timeframe check — nothing else. Horizon Gold Trend EA is a standalone expert advisor for MetaTrader 5, built exclusively for GOLD (XAUUSD) on the M5 chart. The signal, the filter, the exits and the lot sizing are all built into the EA i
Flat Reversion Radar is a mean-reversion screener for MetaTrader 5. For up to 12 watch symbols it measures how far each price has stretched away from its own mean, using a least-squares regression centre, residual standard-deviation bands and a z-score, and lists the symbols in a panel sorted by the size of the deviation. For the chart symbol it draws the regression channel: the centre line, the +/-1 sigma bands and the +/-2 sigma bands. The z-score puts every symbol on the same scale, so a curr
Flat Flag Patterns automatically detects and draws flag and pennant continuation patterns on your MT5 chart. It looks for a strong one-way move (the pole) followed by a small consolidation (the flag), and draws the pole line, the flag zone, a label and arrows directly on the chart. Detection is normalised by volatility (ATR), so the same yardstick applies across symbols and timeframes. For the pole it also checks that the move was clean and one-directional — choppy two-way action does not count
Overview Horizon Combo EA is a fully automated Expert Advisor for MetaTrader 5. It watches whether multiple technical conditions are aligned in the same direction, and when a new alignment is completed it opens a position with a stop loss derived from the ATR at that moment and a take profit placed by a risk-reward ratio (default 3.0). The recommended setting is GOLD on the 1-hour timeframe, using the built-in "GOLD 1H Recommended" preset. Position size is calculated from the risk percentage of
Horizon Confluence EA is a fully automated trend-following Expert Advisor for MetaTrader 5. It watches swing direction across several timeframes at once and enters only when the directions come together (confluence). It does not use grid, martingale or averaging-down techniques: every position is opened with a stop loss, and the exit is handled by an ATR-based trailing stop, with an optional partial close. The default settings are tuned for XAUUSD (GOLD) on the M15 chart. The EA trades the symbo
Horizon SMC Suite MT5 — the all-in-one SMC / ICT dashboard One indicator that draws the full Smart Money Concepts map on a single chart: market structure, order blocks, fair value gaps, liquidity, a full volume profile, sessions and killzones — and grades every zone by how many profile elements overlap it. Modules - Market structure: major / internal BOS and CHoCH, HH / HL / LH / LL swing labels, premium / discount bands with equilibrium - Order blocks and fair value gaps (with CE line), includi
What it is Horizon Currency Strength MT5 is a currency strength meter for MetaTrader 5. It computes the relative strength of the 8 major currencies (USD, EUR, GBP, JPY, AUD, NZD, CAD, CHF) from all 28 related pairs and shows them as a 0-100 ranking on a panel in the chart window. It is a display-only indicator: it does not place trades. How the score is calculated For each of the 28 pairs, the indicator measures the price change over a lookback period, normalized by ATR so that pairs with differ
Filtrer:
Aucun avis
Répondre à l'avis