Quant Trend Cloud
- Indicatori
- Versione: 1.0

Quant Trend Cloud
A cloud that is a regime, not a thread: the band between two slow adaptive lines. No arrows and no dots - the colour says which way the regime stands, and the brightness says whether the candle and the fast line stand clear of the band on that bar. Version 1.0.
Release notes, chart examples and new product announcements are posted on the TrendTower channel: https://www.mql5.com/en/channels/trendtower
What It Is
The cloud is the band between Kaufman's adaptive average and VIDYA. Both lines are slow, so the band is a regime: measured on gold M5, M20 and H1 and on EURUSD M5 and H1, it changes colour about twenty times in a thousand bars and a colour lives a median of thirty-odd bars. A third line, IE/2, is drawn over it and stays a line - a band between IE/2 and the average turns over about ninety times in a thousand bars, which is price being followed, not a regime being shown. It holds one veto, below.
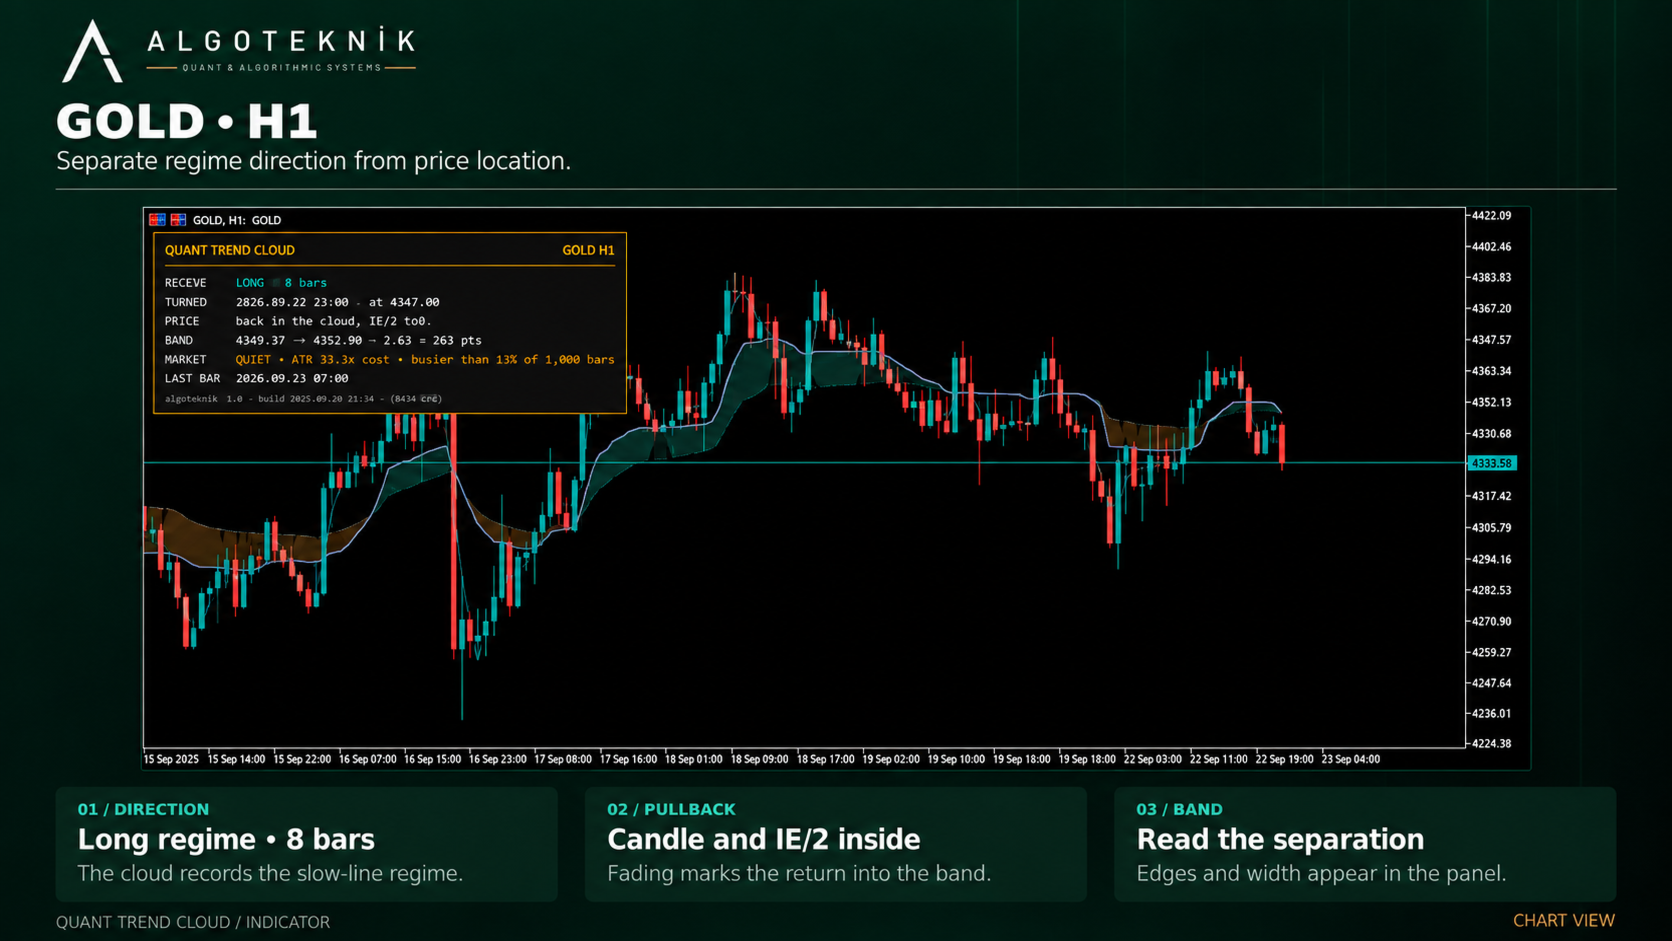
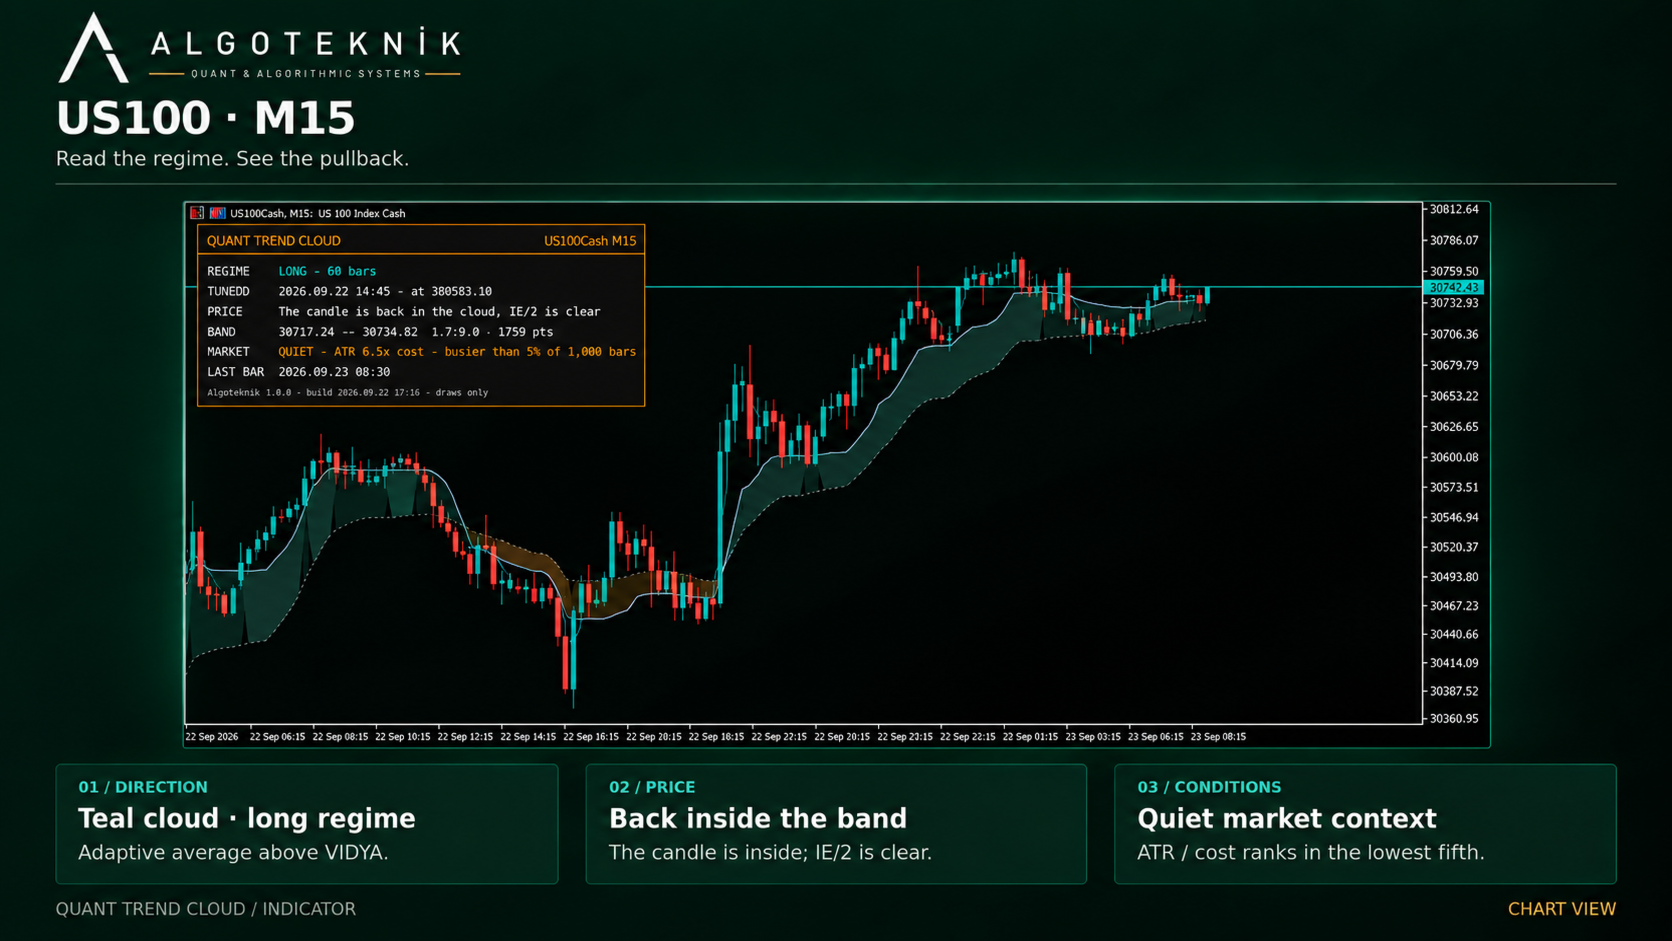
There are no arrows on this chart and no dots. Where the band turns over and where price leaves it are both plain to see, and a mark on top of them is a second opinion nobody asked for. The cloud is drawn in one of two strengths, bar by bar: full colour when the candle opened and closed clear of the whole band, on the cloud's own side, with the IE/2 line clear of it too, and faded when the candle or the line is back inside the band.
The brightness does not confirm a turn. At a crossing the two slow lines are equal, so the band has no thickness, and price - which moved the lines across each other - is already beyond it: measured on seven series (gold M5, M20 and H1, EURUSD M5 and H1, US100 M5, BTCUSD M15), the turn bar itself is already bright on 90 to 93% of turns. What the brightness separates is inside a regime: faded is price that has come back into the band, a pullback, and bright is price standing clear of it.
The line's half of that is a veto, and it is worth knowing what it costs. IE/2 sits a median of a quarter of an ATR from the close - price with the noise taken out - and it is almost never the late one: across gold M5, M20 and H1, EURUSD M5 and H1 and US100 M5 the candle is clear of the band while the line is still inside on four or five bars in a thousand, and those are all the veto removes at the period this ships with - under one in a hundred of the bars where the candle is clear. The traffic the other way is far heavier: on 11% of bars the line is out and the candle is not, and on those bars price joins the line about half the time and the line falls back about half the time. Slow the line to a period of 20 and it removes a third or more of the bars where the candle is clear, at 50 about three quarters - a stricter chart from one number, with the same rule behind it.
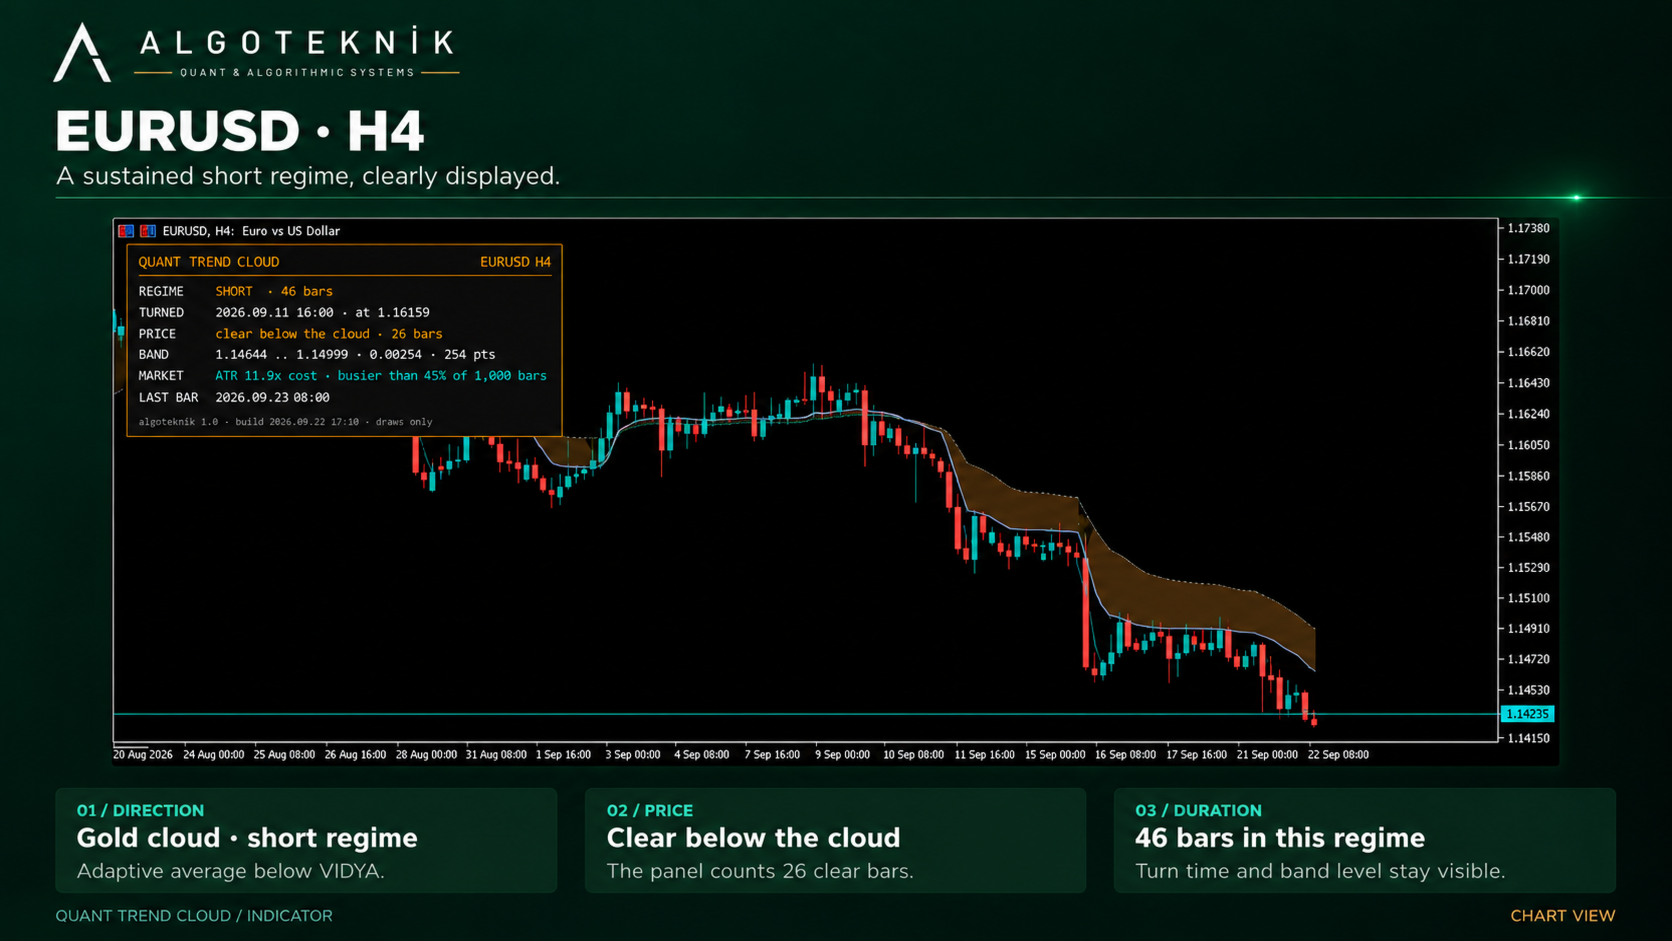
So a chart is read in one pass. The colour is which way the two slow lines stand, the brightness is whether the candle and the fast line stand clear of the band on that bar, and the width of the band is how far apart the two slow lines are. The panel writes all of it in words, and every value is published for an expert.
What The Measurement Says
This indicator makes no claim to make money, and the reason the quiet rule exists is worth stating plainly. The numbers below were measured on the crossing this indicator grew out of - IE/2 against the adaptive average, with a VIDYA trend filter - and not on the cloud it draws now, which has not been put through the same test. That crossing was measured on twelve years of gold, M5 resampled to M20, with the spread charged at tick level and one spread per round trip. Taken raw, a crossing's gross move was about a tenth of what it cost. With a trend filter, the gross move per crossing was 0.03 against a cost of 0.62 across 2015-2024, and 2.29 against 0.67 in the volatile, trending market of 2025-2026. Crossings taken while ATR was under twelve times the cost lost money over the whole period.
Twelve is gold's number, and that matters. ATR divided by the cost has a median of 19.6 on gold M20 and 1.3 on EURUSD M5 - the same ratio an order of magnitude apart, because the two markets differ in how much a bar offers per unit of spread. Read as a law, the limit would call a EURUSD M5 chart quiet for ever. So what ships is the same idea as a rank: a market is quiet when the range it offers per unit of cost sits in the lowest fifth of its own last 1,000 bars, which flags 20 to 22 percent of the bars on every series measured - the dead hours, not the cheap symbols. Gold's absolute limit is still in the settings, off by default. On a broker whose history records no spread - some record none at all, and a custom symbol never does - the rank is taken of ATR itself and the panel says so, instead of calling every bar quiet. The quiet market is reported, never hidden.
On The Chart
The cloud's edges are Kaufman's adaptive average, which speeds up in a trend and nearly stops in chop, and a VIDYA line whose step is scaled by how one-sided recent moves were. IE/2 - the integral of the linear regression slope averaged with the regression line, de-biased so its level does not depend on where the chart's history begins - is drawn over them, and has to be clear of the band for a bar to be bright. Hiding the line does not turn that off.
Nothing drawn on a closed bar is ever redrawn. The alerts - the band turning over, and the first bar of that regime where the candle and the line are both clear of it - are read from the last closed bar, once each per regime, whether or not the panel is shown; a fresh attach or a changed setting does not alert for a bar that closed before it. The lines and the cloud do update on the bar that is still forming, as every moving average does, so the colour and brightness of the forming bar are not a signal until it closes.
The Panel
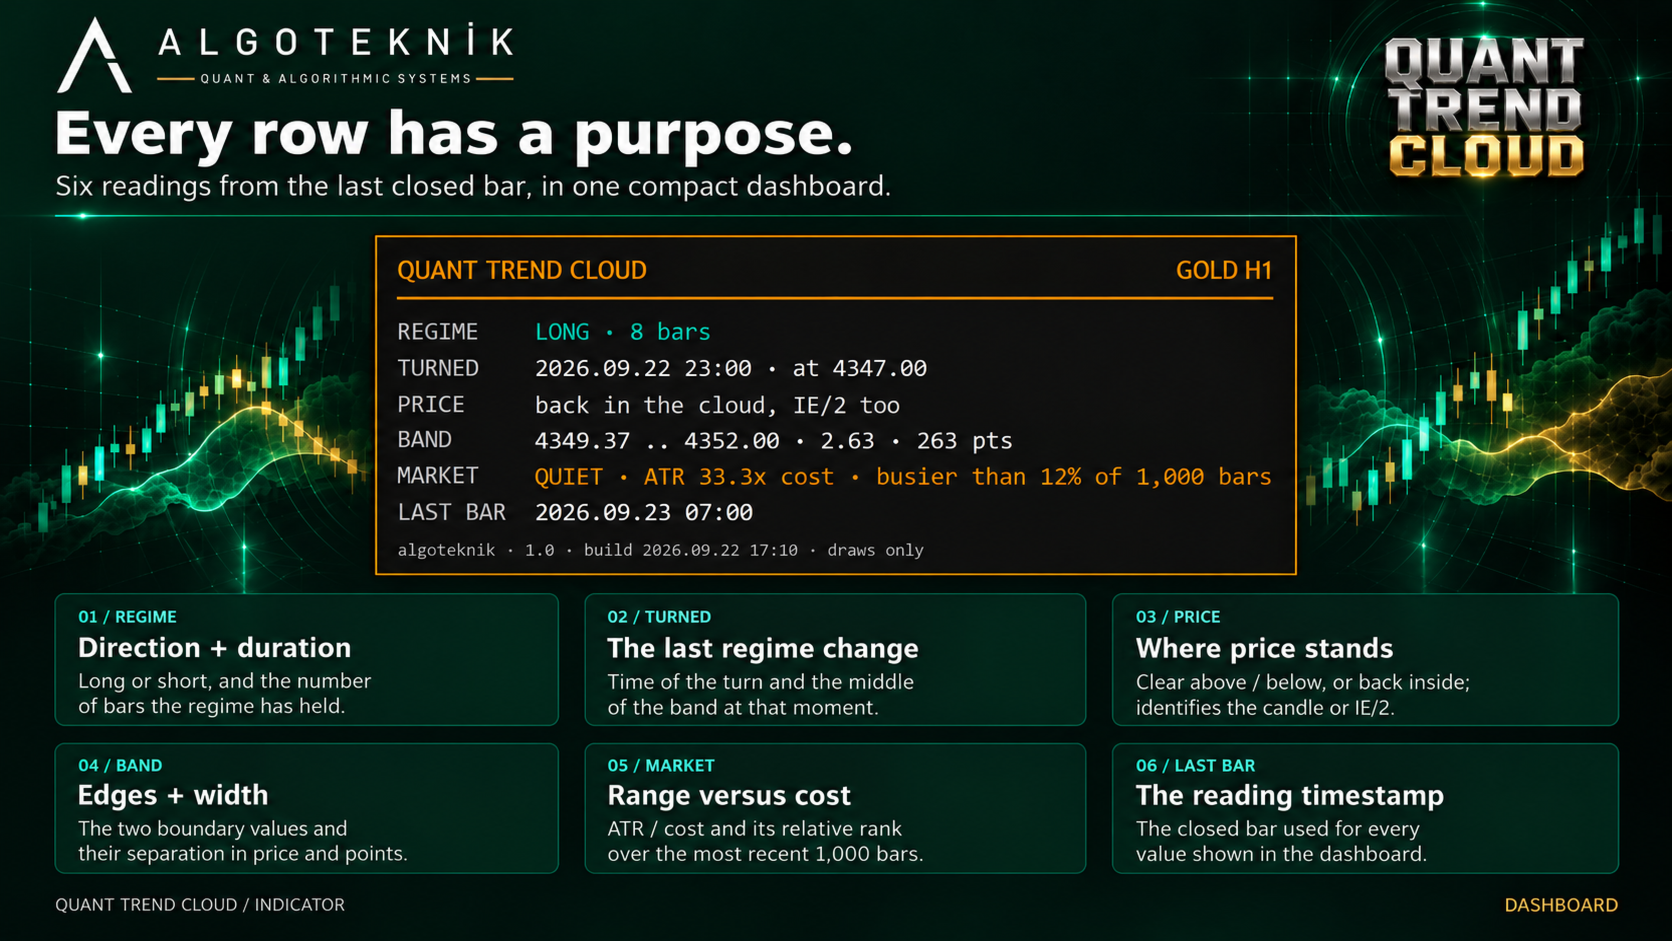
Six rows: the regime and how many bars it has held; when it last turned and the middle of the band at that moment; whether price is clear above or below the cloud and for how long, or - on a faded bar - which half is back in the band, the candle or the line; the two edges of the band and its width in price, in points or in both; ATR as a multiple of the cost with where that stands in the last 1,000 bars; and the closed bar every value was read from. An onyx plate with a gold rule under the header, Trebuchet for the headers and Consolas for the data so the columns line up. Every line is measured with the face that draws it and the plate is as wide as the widest line it holds, so a long value wraps onto a second line and the frame grows with it instead of letting text run past the border. Anchor it to any of the four corners, or drag it with the mouse, and it stays where you put it across restarts.
For Expert Advisors
Every value on the chart is published for iCustom: the three lines, the side of the band, whether the candle and the line are clear of it, where the fast line stands, whether the market is quiet, the ATR-to-cost ratio and its rank. The clear flag is a state of the bar and not a confirmation of the turn - on 90 to 93% of turns it is already on at the turn bar itself, so entering on its first appearance in a new regime is entering on the crossing. Inside a regime it marks the pullbacks: off while price is back in the band, on again where price leaves it. The buffer indexes are listed in the manual.
Settings
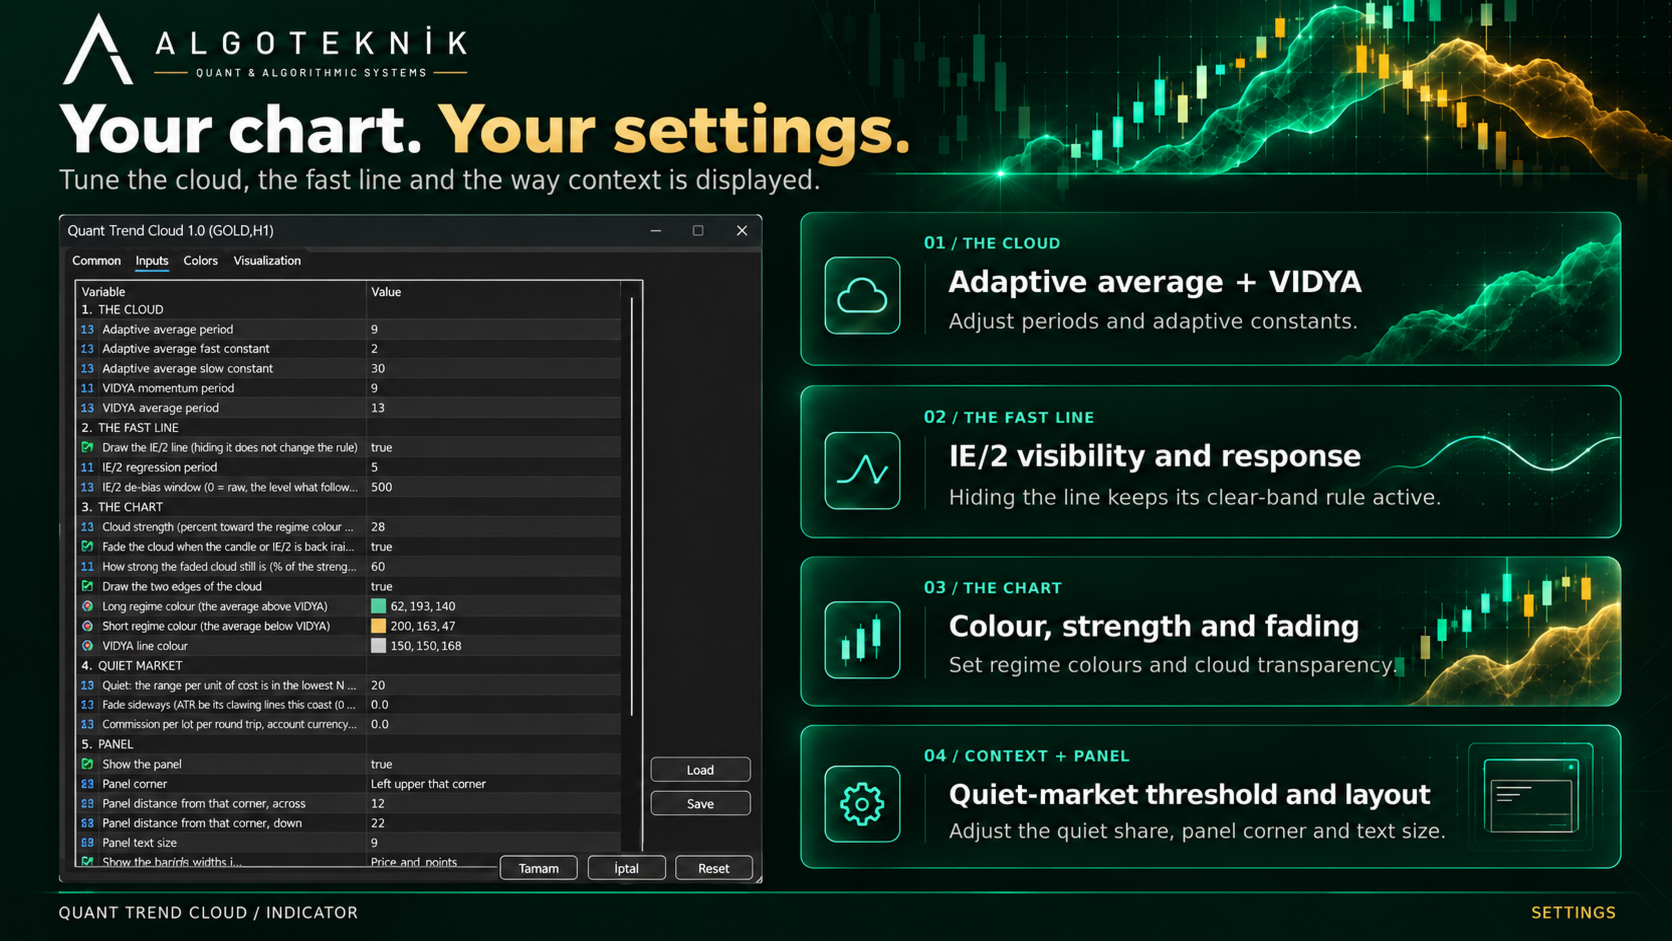
The cloud, the fast line and its veto, the chart, the quiet market, the panel and the alerts. The full reference, one line per setting with the value it ships at, is in the manual that comes with the product.
Attach one copy per chart: the panel's objects are named for the product, not for the copy, so a second copy on the same chart removes the first one's panel. Every period is accepted from 2 to 200, the IE/2 de-bias window from 0 to 5000, the cloud and faded strengths from 0 to 100, the quiet share from 0 to 90 and the panel text size from 7 to 16; anything outside is refused at start, with the limit named.
Questions, bug reports and feature requests are welcome on the TrendTower channel: https://www.mql5.com/en/channels/trendtower
Disclaimer
This is an indicator for analysis and decision support. It does not trade. Past measurement is a description of the past, not a forecast. Always test thoroughly before using any tool with real money. Trading involves risk.
algoteknik
Support, updates and every other product: mql5.com/en/users/bugraky123
Product channel: mql5.com/en/channels/trendtower