Effort Versus Result
- Indicateurs
- Version: 1.0
- Activations: 5

# Effort Versus Result - Four bar categories
*Category: Volume | Difficulty: intermediate | Window: separate window below the chart | Markets: Universal (Forex, indices, commodities, crypto, stocks) | Suggested timeframes: M15, M30, H1, H4, D1*
## Short description
> Classifies every bar by comparing effort, the volume, with result, the range, both as standard scores. Four categories with distinct operational meaning follow.
### Overview
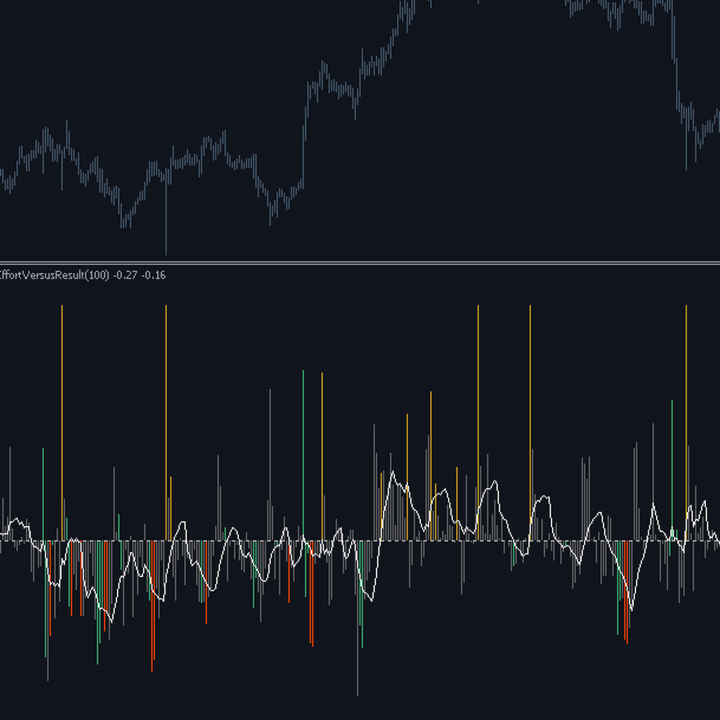
The effort versus result principle is one of the foundations of classic volumetric analysis, but it is almost always applied by eye. This indicator makes it measurable. It expresses both quantities as standard scores relative to their own recent distribution, a step without which the comparison would be meaningless, since volume and price are measured in completely different units. Four bar categories follow, each with a distinct operational meaning: high effort with high result is participation that produces, the signature of a healthy move; high effort with low result is absorption, someone is taking the other side without letting price move; low effort with high result indicates a thin market, the move is fragile and often fades; low effort with low result is simply an irrelevant bar.
### How the calculation works
1. The effort of a bar is its volume; the result is its range, that is how much price was actually covered.
2. Both quantities are standardised against their own distribution over the last InpStatPeriod bars.
3. Standardisation is indispensable: without it, comparing a volume with a range would have no meaning.
4. The histogram shows by how much the result score exceeds the effort score, clamped for readability.
5. The colour classifies the bar into the four categories based on the sign and size of the two scores.
6. If either series is constant within the window, classification is impossible and the bar is marked as irrelevant.
### How to use it
- Green bars indicate participation that produces movement: these are the bars to follow in direction.
- Red bars indicate absorption: heavy volume not moving price, often the prelude to a reversal.
- Gold bars indicate a thin market: movement exists but is unsupported and has a high chance of fading.
- A sequence of red bars near a price extreme is one of the most significant configurations in volumetric analysis.
- Raise InpHighZ for a more selective classification, recognising only bars clearly above or below the norm.
### Who it is for and on which timeframes
It targets students of volumetric analysis who want to automate a classification normally done by eye, with all the subjectivity that entails. It works from M15 to D1. Understanding standard scores helps but is not essential, because the four categories are described in operational terms. It is particularly useful to traders who already have a price action strategy and want to add an objective participation filter.
### Practical example of reading a signal
On DAX40 H1 price rises towards a previous high. The first bars of the advance are green: effort and result both high, the move is healthy. On reaching the level, three consecutive red bars appear: volume stays very high but the range compresses, price can no longer advance. Someone is absorbing all the buying at that level. The trader who was long closes or tightens the stop; anyone looking for a reversal finds the entry context here, with a stop above the high of the absorption bars. Price falls over the following sessions.
## Input parameters
| Parameter | Default | Description |
|---|---|---|
| `InpStatPeriod` | 100 | Window over which effort and result are standardised. Below 60 the estimates become unstable and the classification noisy. |
| `InpSignalPeriod` | 9 | Period of the signal average overlaid on the histogram. |
| `InpHighZ` | 0.75 | Standard score beyond which effort or result is deemed high. Raising it yields a more selective classification. |
| `InpUseRealVolume` | false | With true, real volume is used when available; with false, or in its absence, tick volume. |
## Advantages / strengths
- It makes objective and repeatable a classification that in classic volumetric analysis depends entirely on the observer eye.
- Standardisation makes legitimate the comparison between two quantities measured in completely different units.
- Four categories with distinct operational implications, instead of the usual binary distinction between high and low volume.
- It explicitly handles the degenerate constant series case, instead of producing meaningless values.
## Limitations and warnings
- The classification thresholds are symmetric and identical for both quantities, a reasonable but not optimal choice on every market.
- It uses the range as result measure and ignores direction: a wide bar closing mid-range counts the same as one closing at the extreme.
- After a regime change the standardisation window still holds the old behaviour and the classification is distorted.
- On forex tick volume makes the effort score less reliable.
**No repaint:** values printed on a closed bar are never modified afterwards.
**Disclaimer.** This product is a technical analysis tool, not an automated trading system, and it offers no profit guarantee whatsoever. Financial markets carry the risk of total loss of the invested capital. Past performance is not indicative of future results. Every signal must be confirmed with your own analysis, a money management plan and prior testing on a demo account. The author is not responsible for trading decisions taken on the basis of this indicator.
## Suggested tags / keywords for MQL5
`volume`, `effort result`, `absorption`, `vsa`, `classification`, `z score`, `no repaint`, `price action`