Produits publiés

This easy to setup indicator shows you the market volumes in a different way, with support and resistance as showed. You can setup: - Backdays volume to show - Heiken Ashi candle view It works for every kind of graph and every kind of period. The program shows the volumes based on the number of candles displayed in the chart: the more candles the more volumes. Enjoy this very useful indicator.
Please feel free to message me to report any kind of improvements! :D

# Level Strength Ranker - Only the two levels that matter
*Category: Support and Resistance | Difficulty: intermediate | Window: chart window (overlaid on price) | Markets: Universal (Forex, indices, commodities, crypto, stocks) | Suggested timeframes: M30, H1, H4, D1*
## Short description
> Scores every level by number of touches, size of reactions and recency, drawing only the strongest one above and below price.
## Full description
### Overview
Not all levels are equal. A level touched

# Reversal Probability Gauge - Historical frequency by analogy
*Category: Oscillators | Difficulty: advanced | Window: separate window below the chart | Markets: Universal (Forex, indices, commodities, crypto, stocks) | Suggested timeframes: M30, H1, H4, D1*
## Short description
> Searches history for bars with a state similar to the current one and counts in what percentage of those cases price then moved the opposite way. It is an observed frequency, not a forecast.
## Full description
#

# Overbought Duration Tracker - How long the extreme has lasted
*Category: Oscillators | Difficulty: intermediate | Window: separate window below the chart | Markets: Universal (Forex, indices, commodities, crypto, stocks) | Suggested timeframes: M15, M30, H1, H4, D1*
## Short description
> Measures how many bars the oscillator has spent in the extreme zone and compares it with the average duration of past stays. It avoids the error of selling on the first overbought touch.
## Full descript

# Volatility Scaled RSI - Strength separated from volatility
*Category: Oscillators | Difficulty: intermediate | Window: separate window below the chart | Markets: Universal (Forex, indices, commodities, crypto, stocks) | Suggested timeframes: M15, M30, H1, H4, D1*
## Short description
> A relative strength index where every change is normalised by the volatility of its own moment. It measures pure direction instead of a blend of direction and volatility.
## Full description
### Overview

# Extreme Reading Frequency - How rare is this extreme
*Category: Oscillators | Difficulty: intermediate | Window: separate window below the chart | Markets: Universal (Forex, indices, commodities, crypto, stocks) | Suggested timeframes: M15, M30, H1, H4, D1*
## Short description
> Measures how frequently the oscillator has crossed the thresholds over recent bars. A rare extreme is informative, a frequent one is simply that market norm.
## Full description
### Overview
When an oscillator
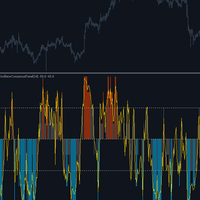
# Oscillator Consensus Panel - Four comparable oscillators
*Category: Oscillators | Difficulty: intermediate | Window: separate window below the chart | Markets: Universal (Forex, indices, commodities, crypto, stocks) | Suggested timeframes: M15, M30, H1, H4, D1*
## Short description
> Computes four oscillators built on different principles and makes them comparable by converting them into percentile ranks, before aggregating them into a consensus measure.
## Full description
### Overview

# Dual Range Oscillator - Two ranges compared
*Category: Oscillators | Difficulty: beginner | Window: separate window below the chart | Markets: Universal (Forex, indices, commodities, crypto, stocks) | Suggested timeframes: M15, M30, H1, H4, D1*
## Short description
> Measures the price position within two ranges of very different length and shows their difference. It separates a move just started from one already mature on every scale.
## Full description
### Overview
Price can sit at t

# Cycle Phase Oscillator - Cycle position in degrees
*Category: Oscillators | Difficulty: advanced | Window: separate window below the chart | Markets: Universal (Forex, indices, commodities, crypto, stocks) | Suggested timeframes: M30, H1, H4, D1*
## Short description
> Expresses the market position in its own cycle as a phase angle from minus one hundred eighty to plus one hundred eighty degrees, with an amplitude measure indicating how reliable the phase is.
## Full description
### Over

# Mean Reversion Pressure - Deviation that actually pays
*Category: Oscillators | Difficulty: advanced | Window: separate window below the chart | Markets: Universal (Forex, indices, commodities, crypto, stocks) | Suggested timeframes: M30, H1, H4, D1*
## Short description
> Measures price deviation from the mean and weights it by the market actual tendency to revert, estimated on recent data. It signals only when the deviation is exploitable.
## Full description
### Overview
It is not en

# Adaptive Stochastic Bands - Soglie che si muovono
*Categoria: Oscillatori | Difficolta: intermedio | Finestra: finestra separata sotto il grafico | Mercati: Universale (Forex, indici, materie prime, crypto, azioni) | Timeframe consigliati: M15, M30, H1, H4, D1*
## Descrizione breve
> Oscillatore con bande calcolate sulla propria distribuzione recente invece che con soglie fisse. In un trend forte le bande si alzano e i falsi segnali contrari spariscono.
## Descrizione lunga
### Panoramic

# Percentile Rank Oscillator - Thresholds that are frequencies
*Category: Oscillators | Difficulty: beginner | Window: separate window below the chart | Markets: Universal (Forex, indices, commodities, crypto, stocks) | Suggested timeframes: M15, M30, H1, H4, D1*
## Short description
> An oscillator based on the percentile rank of price within its own recent distribution. A value of 90 always and everywhere means price is higher than ninety per cent of observations.
## Full description
###

# Liquidity Vacuum Finder - The empty corridors of price
*Category: Volume | Difficulty: advanced | Window: chart window (overlaid on price) | Markets: Universal (Forex, indices, commodities, crypto, stocks) | Suggested timeframes: M15, M30, H1, H4, D1*
## Short description
> Identifies price bands crossed on low volume, where nothing will slow price on its return. It draws the nearest vacuum above and below current price.
### Overview
The concept is the exact complement of the volume prof

# Relative Volume Heatmap - Volume relative to its own hour
*Category: Volume | Difficulty: beginner | Window: separate window below the chart | Markets: Universal (Forex, indices, commodities, crypto, stocks) | Suggested timeframes: M5, M15, M30, H1*
## Short description
> Compares the bar volume with the historical average of the same hour band and colours it on four levels. It spots genuine participation anomalies, not clock effects.
### Overview
Absolute volume is nearly useless on int

# Accumulation Phase Scanner - Compressed range, high volume
*Category: Volume | Difficulty: intermediate | Window: separate window below the chart | Markets: Universal (Forex, indices, commodities, crypto, stocks) | Suggested timeframes: M15, M30, H1, H4, D1*
## Short description
> Recognises accumulation phases by combining three conditions: range compressed versus normal, volume above average and no net price progress.
### Overview
Accumulation has a recognisable signature: price stays

# Effort Versus Result - Four bar categories
*Category: Volume | Difficulty: intermediate | Window: separate window below the chart | Markets: Universal (Forex, indices, commodities, crypto, stocks) | Suggested timeframes: M15, M30, H1, H4, D1*
## Short description
> Classifies every bar by comparing effort, the volume, with result, the range, both as standard scores. Four categories with distinct operational meaning follow.
### Overview
The effort versus result principle is one of the fou

# Round Number Magnet - Do round numbers really matter?
*Category: Support and Resistance | Difficulty: beginner | Window: chart window (overlaid on price) | Markets: Universal (Forex, indices, commodities, crypto, stocks) | Suggested timeframes: M15, M30, H1, H4, D1*
## Short description
> Draws round levels with an automatically computed step and measures how much price actually reacts to them on this specific instrument.
## Full description
### Overview
Round numbers attract orders: st

# Volume Divergence Tracker - Price to volume correlation
*Category: Volume | Difficulty: intermediate | Window: separate window below the chart | Markets: Universal (Forex, indices, commodities, crypto, stocks) | Suggested timeframes: M15, M30, H1, H4, D1*
## Short description
> Measures the rolling correlation between the size of price moves and the change in volume. It recognises when movement loses the support of participation.
### Overview
In a healthy market price and volume move tog

# Break Retest Detector - The full sequence, not just the break
*Category: Support and Resistance | Difficulty: intermediate | Window: chart window (overlaid on price) | Markets: Universal (Forex, indices, commodities, crypto, stocks) | Suggested timeframes: M15, M30, H1, H4, D1*
## Short description
> Recognises the full sequence of break, return to the level and reaction. It signals only when all three conditions occur in the correct order.
## Full description
### Overview
Breaking a le

# Supply Demand Zone Mapper - Compressed base and decisive departure
*Category: Support and Resistance | Difficulty: intermediate | Window: chart window (overlaid on price) | Markets: Universal (Forex, indices, commodities, crypto, stocks) | Suggested timeframes: M15, M30, H1, H4, D1*
## Short description
> Recognises consolidation bases followed by a decisive move and draws them as zones, which remain until price crosses them fully.
## Full description
### Overview
A demand zone forms wh

# HTF Level Projector - The levels everyone watches
*Category: Multi Timeframe Hybrids | Difficulty: beginner | Window: chart window (overlaid on price) | Markets: Universal (Forex, indices, commodities, crypto, stocks) | Suggested timeframes: M5, M15, M30, H1, H4*
## Short description
> Projects onto the current chart the high, low and close of the last complete higher period, updating only on period close.
## Full description
### Overview
Yesterday high and low are shared references, no
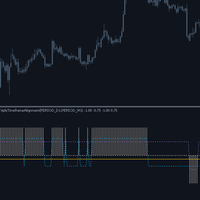
# Triple Timeframe Alignment - Three horizons, one score
*Category: Multi Timeframe Hybrids | Difficulty: intermediate | Window: separate window below the chart | Markets: Universal (Forex, indices, commodities, crypto, stocks) | Suggested timeframes: M5, M15, M30, H1, H4*
## Short description
> Checks whether current, middle and higher timeframes point the same way, showing both the overall score and each horizon direction.
## Full description
### Overview
Full alignment of the three tim

# Higher Timeframe Bias - The higher timeframe without deception
*Category: Multi Timeframe Hybrids | Difficulty: intermediate | Window: separate window below the chart | Markets: Universal (Forex, indices, commodities, crypto, stocks) | Suggested timeframes: M5, M15, M30, H1, H4*
## Short description
> Brings a higher timeframe direction onto the current chart using only already closed bars, avoiding the most insidious form of repaint.
## Full description
### Overview
Multi timeframe ind

# Momentum Thrust Pattern - Thrust, pause, resumption
*Category: Pattern Recognition | Difficulty: intermediate | Window: chart window (overlaid on price) | Markets: Universal (Forex, indices, commodities, crypto, stocks) | Suggested timeframes: M15, M30, H1, H4, D1*
## Short description
> Recognises the thrust, contained pause and resumption beyond the extreme sequence, signalling only once all three phases have completed.
## Full description
### Overview
Directional moves almost always
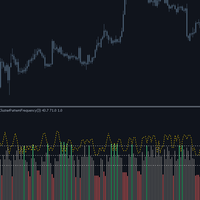
# Cluster Pattern Frequency - Eight sequences and their statistics
*Category: Pattern Recognition | Difficulty: advanced | Window: separate window below the chart | Markets: Universal (Forex, indices, commodities, crypto, stocks) | Suggested timeframes: M30, H1, H4, D1*
## Short description
> Encodes every three bar sequence into one of eight possible configurations and measures the historical frequency of it being followed by an upward move.
## Full description
### Overview
Every three b

# Three Bar Structure Map - Geometry without thresholds
*Category: Pattern Recognition | Difficulty: beginner | Window: separate window below the chart | Markets: Universal (Forex, indices, commodities, crypto, stocks) | Suggested timeframes: M15, M30, H1, H4, D1*
## Short description
> Classifies every three bar group into four geometric configurations, using no arbitrary threshold: two bars either exceed each other or they do not.
## Full description
### Overview
Every group of three co

# Pin Bar Rejection Scanner - Rejection where it matters
*Category: Pattern Recognition | Difficulty: intermediate | Window: chart window (overlaid on price) | Markets: Universal (Forex, indices, commodities, crypto, stocks) | Suggested timeframes: M15, M30, H1, H4, D1*
## Short description
> Recognises bars with a dominant wick but flags them only when they are significant in absolute terms and occur at a recent extreme.
## Full description
### Overview
A bar with a very long wick tells

# Inside Bar Breakout Map - Compression with ready levels
*Category: Pattern Recognition | Difficulty: beginner | Window: chart window (overlaid on price) | Markets: Universal (Forex, indices, commodities, crypto, stocks) | Suggested timeframes: M15, M30, H1, H4, D1*
## Short description
> Counts consecutive inside bars and draws the two breakout levels of the mother bar, holding them fixed while the pattern is active.
## Full description
### Overview
An inside bar, entirely contained wit

# Engulfing Quality Score - Not all engulfings are equal
*Category: Pattern Recognition | Difficulty: intermediate | Window: chart window (overlaid on price) | Markets: Universal (Forex, indices, commodities, crypto, stocks) | Suggested timeframes: M15, M30, H1, H4, D1*
## Short description
> Checks the engulfing pattern and scores it on four additional criteria, flagging only those exceeding the quality threshold.
## Full description
### Overview
The engulfing pattern is among the best k

# Candle Body Anatomy - Candle proportions in numbers
*Category: Pattern Recognition | Difficulty: beginner | Window: separate window below the chart | Markets: Universal (Forex, indices, commodities, crypto, stocks) | Suggested timeframes: M15, M30, H1, H4, D1*
## Short description
> Splits every candle into body and wicks as a percentage of the range and classifies it on explicit numeric thresholds instead of qualitative judgement.
## Full description
### Overview
Traditional candle nam

# Level Decay Model - A level that wears out
*Category: Support and Resistance | Difficulty: advanced | Window: chart window (overlaid on price) | Markets: Universal (Forex, indices, commodities, crypto, stocks) | Suggested timeframes: M30, H1, H4, D1*
## Short description
> Assigns each level a strength that decays over time and with every test it undergoes. The level is abandoned once residual strength falls below the threshold.
## Full description
### Overview
A level does not have unl

# Range Boundary Tracker - Edges that do not follow price
*Category: Support and Resistance | Difficulty: intermediate | Window: chart window (overlaid on price) | Markets: Universal (Forex, indices, commodities, crypto, stocks) | Suggested timeframes: M15, M30, H1, H4, D1*
## Short description
> Recognises when the market enters a range, fixes its two extremes and holds them still while the range lasts, as a trader would draw them.
## Full description
### Overview
A channel that follows

# False Breakout Filter - The failed break as a signal
*Category: Support and Resistance | Difficulty: intermediate | Window: chart window (overlaid on price) | Markets: Universal (Forex, indices, commodities, crypto, stocks) | Suggested timeframes: M15, M30, H1, H4, D1*
## Short description
> Watches every break for a fixed number of bars and classifies it only afterwards. A failed break produces an arrow the opposite way, because it is itself a signal.
## Full description
### Overview
E

# Confluence Score Map - Where several references converge
*Category: Support and Resistance | Difficulty: advanced | Window: chart window (overlaid on price) | Markets: Universal (Forex, indices, commodities, crypto, stocks) | Suggested timeframes: M30, H1, H4, D1*
## Short description
> Computes four independent families of levels and draws only the price bands where at least the required minimum number of references converges.
## Full description
### Overview
A level where several inde

# Untested Level Finder - The levels still intact
*Category: Support and Resistance | Difficulty: beginner | Window: chart window (overlaid on price) | Markets: Universal (Forex, indices, commodities, crypto, stocks) | Suggested timeframes: M15, M30, H1, H4, D1*
## Short description
> Draws only the swing levels price has never retested since they formed. A level stops being drawn the moment it is tested.
## Full description
### Overview
A level that has already rejected price three times

# Dynamic Pivot Zones - Pivots as zones, not lines
*Category: Support and Resistance | Difficulty: beginner | Window: chart window (overlaid on price) | Markets: Universal (Forex, indices, commodities, crypto, stocks) | Suggested timeframes: M5, M15, M30, H1*
## Short description
> Turns pivots into zones whose width depends on the previous period volatility. The levels stay fixed for the whole session, with no recalculation.
## Full description
### Overview
Classic pivots are infinitely

# Timeframe Divergence Monitor - When horizons disagree
*Category: Multi Timeframe Hybrids | Difficulty: intermediate | Window: separate window below the chart | Markets: Universal (Forex, indices, commodities, crypto, stocks) | Suggested timeframes: M5, M15, M30, H1, H4*
## Short description
> Measures the momentum disagreement between current and higher timeframes, highlighting phases where the two horizons move in opposite directions.
## Full description
### Overview
When the current t

# Smart Money Flow Index - Opening versus rest of the day
*Category: Volume | Difficulty: intermediate | Window: separate window below the chart | Markets: Indices | Suggested timeframes: M5, M15, M30, H1*
## Short description
> Separates money flow between the first session hours and the rest of the day, showing their divergence. A time based convention, not a measure of who is trading.
### Overview
There is a long standing observation in equity market analysis: the first part of a sessio

# Volume Climax Detector - The signature of absorption
*Category: Volume | Difficulty: intermediate | Window: chart window (overlaid on price) | Markets: Universal (Forex, indices, commodities, crypto, stocks) | Suggested timeframes: M15, M30, H1, H4, D1*
## Short description
> Recognises climax bars: exceptional volume, wide range but small body, that is price pushing far and coming back. It marks the bars with arrows on the chart.
### Overview
A volume spike alone means nothing: it can a

# Rate Of Change Spectrum - Which horizon is driving
*Category: Momentum | Difficulty: advanced | Window: separate window below the chart | Markets: Universal (Forex, indices, commodities, crypto, stocks) | Suggested timeframes: M30, H1, H4, D1*
## Short description
> Standardises the rate of change over six horizons and identifies which one is driving the move. It shows the dominant scale score and its rank.
### Overview
Knowing the market is rising tells you little. Knowing whether it ri

# Momentum Curvature - Acceleration versus velocity
*Category: Momentum | Difficulty: intermediate | Window: separate window below the chart | Markets: Universal (Forex, indices, commodities, crypto, stocks) | Suggested timeframes: M15, M30, H1, H4, D1*
## Short description
> Measures price acceleration, the second derivative of the smoothed series, and compares it with velocity. It detects loss of thrust before direction changes.
### Overview
Anyone who drives knows the brake pedal acts o

# Normalized Momentum Z - Momentum in standard scores
*Category: Momentum | Difficulty: intermediate | Window: separate window below the chart | Markets: Universal (Forex, indices, commodities, crypto, stocks) | Suggested timeframes: M15, M30, H1, H4, D1*
## Short description
> Standardises momentum against its own recent historical distribution and returns a z score. A value of +2 marks a thrust stronger than roughly 97 per cent of the instrument recent moves.
### Overview
Raw momentum ha

# Trend Exhaustion Meter - Composite exhaustion score
*Category: Trend | Difficulty: advanced | Window: separate window below the chart | Markets: Universal (Forex, indices, commodities, crypto, stocks) | Suggested timeframes: M30, H1, H4, D1*
## Short description
> A 0 to 100 score combining stretch from the mean, directional saturation and momentum fade. It measures the continuation risk of a move, not its reversal.
### Overview
No single symptom says a trend is about to end, but when se

# Regression Confidence Baseline - Bands on residual error
*Category: Trend | Difficulty: intermediate | Window: chart window (overlaid on price) | Markets: Universal (Forex, indices, commodities, crypto, stocks) | Suggested timeframes: M15, M30, H1, H4, D1*
## Short description
> Linear regression baseline with bands built on the residual standard error instead of the price standard deviation. Bands widen when the move loses order, not when price runs.
### Overview
Classic volatility band

# Trend Age Counter - Regime age versus typical duration
*Category: Trend | Difficulty: intermediate | Window: separate window below the chart | Markets: Universal (Forex, indices, commodities, crypto, stocks) | Suggested timeframes: M30, H1, H4, D1*
## Short description
> Counts how many bars the current regime has lasted and compares it with the average duration of all past regimes on the same instrument. It measures trend maturity, not strength.
### Overview
Every trend indicator answer

# Directional Efficiency - Net path versus gross path
*Category: Trend | Difficulty: intermediate | Window: separate window below the chart | Markets: Universal (Forex, indices, commodities, crypto, stocks) | Suggested timeframes: M15, M30, H1, H4, D1*
## Short description
> Signed ratio between the net distance travelled by price and the gross path actually covered. It separates straight trends from disorderly advances that burn capital.
### Overview
Two markets can rise by the same amoun

# Multi Scale Trend Agreement - Consensus across eight horizons
*Category: Trend | Difficulty: beginner | Window: separate window below the chart | Markets: Universal (Forex, indices, commodities, crypto, stocks) | Suggested timeframes: M5, M15, M30, H1, H4, D1*
## Short description
> Checks price position against its own average on eight geometrically spaced scales and condenses the result into a single score from -100 to +100.
### Overview
A trend worth the name is recognised from whatev

# Kalman Trend Filter - Level and velocity Kalman filter
*Category: Trend | Difficulty: advanced | Window: chart window (overlaid on price) | Markets: Universal (Forex, indices, commodities, crypto, stocks) | Suggested timeframes: M15, M30, H1, H4, D1*
## Short description
> A two state Kalman filter that simultaneously estimates price level and velocity. The gain self-adjusts: it trusts the model when data are consistent and re-adapts immediately to shocks.
### Overview
The Kalman filter

# Trend Persistence Index - Persistence versus randomness
*Category: Trend | Difficulty: advanced | Window: separate window below the chart | Markets: Universal (Forex, indices, commodities, crypto, stocks) | Suggested timeframes: M30, H1, H4, D1*
## Short description
> Compares the direction changes actually observed with those expected from a purely random series. Above zero the market persists in one direction, below zero it keeps flipping.
### Overview
In a random walk the sign of the

# Volatility Adaptive MA - Variable speed moving average
*Category: Trend | Difficulty: intermediate | Window: chart window (overlaid on price) | Markets: Universal (Forex, indices, commodities, crypto, stocks) | Suggested timeframes: M5, M15, M30, H1, H4*
## Short description
> A moving average whose smoothing factor is driven by the ratio between short and long term volatility: it accelerates during breakouts and slows down in compressed phases, cutting false crossovers.
### Overview
Eve

# Fractal Trend Channel - Structural channel from confirmed swings
*Category: Trend | Difficulty: beginner | Window: chart window (overlaid on price) | Markets: Universal (Forex, indices, commodities, crypto, stocks) | Suggested timeframes: M15, M30, H1, H4, D1*
## Short description
> Step channel built from the last confirmed fractal swings, with a midline coloured by market structure: higher highs and lows, lower highs and lows, or mixed structure.
### Overview
Reading structure through

# Adaptive Slope Ribbon - ATR-normalised regression slope ribbon
*Category: Trend | Difficulty: intermediate | Window: separate window below the chart | Markets: Universal (Forex, indices, commodities, crypto, stocks) | Suggested timeframes: M15, M30, H1, H4, D1*
## Short description
> Five linear regression slopes over growing horizons, normalised in ATR units and comparable across instruments. The histogram shows the mean slope coloured by the level of agreement between time scales.
## Fu

Showing like in the picture or in the logo multiple pair, multiple timeframes, multiple indicators in the same time , allowing you to click and go straight on that pair. The indicator will change like a Carosello every 3 seconds and will show you the indicator values also by background color to check in a very fast way if its oversold or overbought . Feel free to ask for adding new pair or indicator , i will update it for free. Pair managed: EURUSD, GBPUSD, USDJPY, AUDUSD, USDCHF. Indicator man

A powerful oscillator that provide Buy and Sell signals by calculating the investor liquidity. The more liquidity the more buy possibilities. The less liquidity the more sell possibilities. Please download the demo and run a backtest!
HOW IT WORKS: The oscillator will put buy and sell arrow on the chart in runtime only . Top value is 95 to 100 -> Investors are ready to buy and you should follow. Bottom value is 5 to 0 -> Investors are ready to sell and you should follow. Alert + sound will appe

# Impulse Strength Gauge - Movement weighted by volume
*Category: Momentum | Difficulty: intermediate | Window: separate window below the chart | Markets: Universal (Forex, indices, commodities, crypto, stocks) | Suggested timeframes: M5, M15, M30, H1, H4*
## Short description
> Weights every bar by combining body size in ATR units with volume relative to its average, then accumulates the contributions. It separates wide but empty bars from genuinely supported impulses.
### Overview
A wide

# Volume Weighted Range Profile - Rolling window profile
*Category: Volume | Difficulty: advanced | Window: chart window (overlaid on price) | Markets: Universal (Forex, indices, commodities, crypto, stocks) | Suggested timeframes: M15, M30, H1, H4, D1*
## Short description
> Builds a volume profile on a rolling window and extracts the point of control and value area. Unlike session profiles, it does not reshape itself during the day.
### Overview
The volume profile identifies the levels w

# Dual Horizon Momentum Delta - Short versus long, time corrected
*Category: Momentum | Difficulty: advanced | Window: separate window below the chart | Markets: Universal (Forex, indices, commodities, crypto, stocks) | Suggested timeframes: M15, M30, H1, H4, D1*
## Short description
> Compares momentum on two horizons after normalising them by the square root of time, a correction without which the long horizon would always look larger by pure construction.
### Overview
Directly comparing

# Momentum Thrust Counter - Counting thrusts beyond threshold
*Category: Momentum | Difficulty: beginner | Window: separate window below the chart | Markets: Universal (Forex, indices, commodities, crypto, stocks) | Suggested timeframes: M15, M30, H1, H4, D1*
## Short description
> Counts bars moving beyond an ATR multiple and reports the net balance. The total line separates calm from battle, both of which show a balance near zero.
### Overview
Most bars on a chart carry no information: t

# Cumulative Delta Proxy - Delta estimated from OHLC and volume
*Category: Volume | Difficulty: intermediate | Window: separate window below the chart | Markets: Universal (Forex, indices, commodities, crypto, stocks) | Suggested timeframes: M5, M15, M30, H1*
## Short description
> Estimates the buyer/seller imbalance from the close position within the range, weighted by volume, accumulating it per session in equivalent imbalance bars.
### Overview
True delta, the difference between volume

# Volume Price Efficiency - Lo spessore del mercato
*Categoria: Volume | Difficolta: intermedio | Finestra: finestra separata sotto il grafico | Mercati: Universale (Forex, indici, materie prime, crypto, azioni) | Timeframe consigliati: M5, M15, M30, H1, H4*
## Descrizione breve
> Misura quanto prezzo viene spostato da una unita di volume. Valori alti indicano un mercato sottile, in cui pochi ordini muovono molto; valori bassi indicano assorbimento.
### Panoramica
Quanto prezzo serve per a

# Volatility Shock Decay - Half-life of post-shock recovery
*Category: Volatility | Difficulty: advanced | Window: separate window below the chart | Markets: Universal (Forex, indices, commodities, crypto, stocks) | Suggested timeframes: H1, H4, D1*
## Short description
> Estimates the persistence coefficient of volatility and derives its half-life, how many bars a deviation from normal needs to halve. It also shows the size of the current shock.
### Overview
When volatility explodes, the

# Downside Upside Vol Ratio - Risk asymmetry
*Category: Volatility | Difficulty: intermediate | Window: separate window below the chart | Markets: Universal (Forex, indices, commodities, crypto, stocks) | Suggested timeframes: H1, H4, D1*
## Short description
> Computes two separate semi-deviations, one on negative returns only and one on positive ones, and reports their proportion. It measures an asymmetry standard deviation conceals.
### Overview
Standard deviation treats an upward and a

# Intraday Volatility Seasonality - Hourly volatility profile
*Category: Volatility | Difficulty: intermediate | Window: separate window below the chart | Markets: Universal (Forex, indices, commodities, crypto, stocks) | Suggested timeframes: M5, M15, M30, H1*
## Short description
> Builds the instrument average hourly volatility profile and compares it with the actual range of the current bar. It separates normally quiet hours from genuine anomalies.
### Overview
Intraday volatility is n

# Compression Expansion Detector - Squeeze and release
*Category: Volatility | Difficulty: intermediate | Window: separate window below the chart | Markets: Universal (Forex, indices, commodities, crypto, stocks) | Suggested timeframes: M15, M30, H1, H4, D1*
## Short description
> Measures how far short term volatility has narrowed relative to the reference, counts how many bars the compression has lasted and highlights the bars following the release.
### Overview
Volatility is not stable:

# Volatility Breakout Projection - Levels projected from the open
*Category: Volatility | Difficulty: beginner | Window: chart window (overlaid on price) | Markets: Universal (Forex, indices, commodities, crypto, stocks) | Suggested timeframes: M5, M15, M30, H1*
## Short description
> Anchors a reference to each session open and projects two pairs of levels computed as fractions of the average daily range. Levels stay fixed for the whole session.
### Overview
If an instrument covers on ave

# Overnight Gap Risk - The risk stops cannot cover
*Category: Volatility | Difficulty: intermediate | Window: separate window below the chart | Markets: Stocks | Suggested timeframes: H1, H4, D1*
## Short description
> Splits each bar change into gap and intra-bar movement, and reports the share of risk attributable to gaps, the part no stop can protect against.
### Overview
The risk of a position held past the close is not the same as that of the same position closed intraday, and the dif

# Garman Klass Volatility - An estimator using the whole OHLC
*Category: Volatility | Difficulty: advanced | Window: separate window below the chart | Markets: Universal (Forex, indices, commodities, crypto, stocks) | Suggested timeframes: M15, M30, H1, H4, D1*
## Short description
> A volatility estimator using open, high, low and close instead of closes only. Its ratio to the classic estimate separates intra-bar movement from close-to-close movement.
### Overview
The standard deviation o

# Volatility Regime Classifier - Classification with hysteresis
*Category: Volatility | Difficulty: intermediate | Window: separate window below the chart | Markets: Universal (Forex, indices, commodities, crypto, stocks) | Suggested timeframes: M15, M30, H1, H4, D1*
## Short description
> Classifies volatility into four regimes using a hysteresis state machine, eliminating the constant flipping typical of fixed thresholds. The active threshold is drawn.
### Overview
Classifying volatility

# Volatility Forecast EWMA - Forecasting the next bar
*Category: Volatility | Difficulty: advanced | Window: separate window below the chart | Markets: Universal (Forex, indices, commodities, crypto, stocks) | Suggested timeframes: M15, M30, H1, H4, D1*
## Short description
> Estimates next bar volatility with an EWMA model on variance, the same scheme used in portfolio risk management, alongside the volatility actually observed.
### Overview
Every volatility indicator looks backwards and

# Realized Volatility Cone - Historical volatility percentiles
*Category: Volatility | Difficulty: intermediate | Window: separate window below the chart | Markets: Universal (Forex, indices, commodities, crypto, stocks) | Suggested timeframes: M30, H1, H4, D1*
## Short description
> Draws realized volatility together with the percentiles of its own historical distribution. It tells whether the current level is high or low for that specific instrument.
### Overview
Knowing that realized vo

# Momentum Entropy Filter - Order versus randomness in thrusts
*Category: Momentum | Difficulty: advanced | Window: separate window below the chart | Markets: Universal (Forex, indices, commodities, crypto, stocks) | Suggested timeframes: M30, H1, H4, D1*
## Short description
> Computes the Shannon entropy of the recent momentum distribution and converts it into an order score from 0 to 100. It separates markets with recurring structure from those without regularity.
### Overview
Shannon e

# Elastic Momentum Band - Momentum driven asymmetric channel
*Category: Momentum | Difficulty: intermediate | Window: chart window (overlaid on price) | Markets: Universal (Forex, indices, commodities, crypto, stocks) | Suggested timeframes: M15, M30, H1, H4*
## Short description
> A channel deforming with momentum: the band favouring the move draws closer to the average, the opposite one moves away. It makes breaks in direction easier and counter breaks more selective.
### Overview
A symm

# Momentum Divergence Scanner - Divergences without repaint
*Category: Momentum | Difficulty: intermediate | Window: chart window (overlaid on price) | Markets: Universal (Forex, indices, commodities, crypto, stocks) | Suggested timeframes: M15, M30, H1, H4, D1*
## Short description
> Flags price to momentum divergences using confirmed swings only. The arrow appears on confirmation and is never withdrawn, unlike almost every other divergence indicator.
### Overview
Almost every divergence

# Impulse Retrace Ratio - Impulse size versus retracement size
*Category: Momentum | Difficulty: intermediate | Window: separate window below the chart | Markets: Universal (Forex, indices, commodities, crypto, stocks) | Suggested timeframes: M15, M30, H1, H4, D1*
## Short description
> Groups consecutive same sign changes into runs and compares the average size of bullish runs with that of bearish ones. It measures whether impulses are larger, not more numerous.
### Overview
A healthy upt

# Volume Support Resistance Map - Supports and resistances drawn by volume
*Category: Experimental | Difficulty: intermediate | Window: chart window (overlaid on price) | Markets: Universal (Forex, indices, commodities, crypto, stocks) | Suggested timeframes: M15, M30, H1, H4, D1*
## Short description
> Horizontal bars drawn on the chart, long in proportion to the volume traded at each level: above price the selling volume marking resistances, below it the buying volume marking supports.
##