Overnight Gap Risk
- Indicateurs
- Version: 1.0
- Activations: 5

# Overnight Gap Risk - The risk stops cannot cover
*Category: Volatility | Difficulty: intermediate | Window: separate window below the chart | Markets: Stocks | Suggested timeframes: H1, H4, D1*
## Short description
> Splits each bar change into gap and intra-bar movement, and reports the share of risk attributable to gaps, the part no stop can protect against.
### Overview
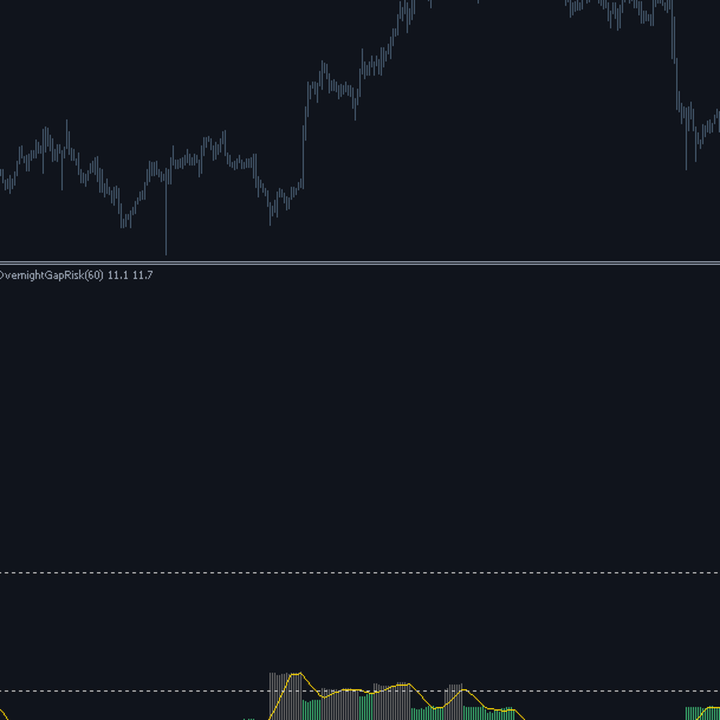
The risk of a position held past the close is not the same as that of the same position closed intraday, and the difference is structural rather than psychological: a stop does not protect against a price jump, because between the close and the next open no prices exist to execute at. A stop order at a given level is simply filled at the open, wherever that is. This indicator makes that risk measurable. It splits each bar change into two independent parts, the jump between the previous close and the open and the movement that happened inside the bar, compares their variances and reports the percentage share attributable to jumps. A value of forty per cent means nearly half the risk of that instrument concentrates in moments when no stop can act.
### How the calculation works
1. For each bar the logarithm of the open to previous close ratio is computed: this is the gap component, non tradable.
2. Then the logarithm of the close to open ratio of the same bar is computed: this is the intra-bar component, tradable.
3. The sum of the two components gives exactly the total bar return, so the decomposition is complete.
4. Over the InpWindow window the separate variances of the two series are computed.
5. The gap risk share is the variance of the gap component divided by the sum of the two variances.
6. Variances are used rather than standard deviations because variances of independent components add up, standard deviations do not.
### How to use it
- Before holding a position past the close, check the value: above the high threshold the stop offers only partial protection.
- On instruments with a high gap share, reduce the size of positions held past the session rather than widening the stop: widening does not help.
- A rising share over time signals the market is concentrating its reactions outside trading hours, typical during announcement periods.
- On continuous markets such as spot forex the value stays low by construction: there the tool is of limited use.
- Useful for comparing two similar instruments and choosing the one with lower gap exposure for the same expected return.
### Who it is for and on which timeframes
It is designed mainly for traders working on equities, cash indices and futures with limited trading hours, precisely the markets where gaps genuinely exist. On spot forex, which trades almost continuously, the value stays structurally low and the indicator has little to say, except over weekends. It works from H1 to D1: on lower timeframes the distinction between gap and intra-bar movement becomes spread dominated. No particular statistical background is required, but the notion of adding variances helps interpret the values correctly.
### Practical example of reading a signal
A trader compares two stocks with almost identical overall volatility. On the first the gap risk share is nine per cent: practically all movement happens during the session and a stop protects effectively. On the second the share is forty two per cent, because the company regularly publishes announcements while markets are closed. For the same position size and stop, the second stock exposes far greater actual risk over every night held. The correct decision is not a wider stop, which would change nothing, but halving the position size or closing before the bell.
## Input parameters
| Parameter | Default | Description |
|---|---|---|
| `InpWindow` | 60 | Number of bars over which the two variances are estimated. Wide windows give steadier estimates, short ones react to announcement periods. |
| `InpSignalPeriod` | 10 | Period of the signal average overlaid on the histogram. |
| `InpHighShare` | 35.0 | Percentage share beyond which gap risk is deemed high and the histogram is coloured red. |
| `InpLowShare` | 10.0 | Share below which gap risk is deemed negligible. If the thresholds are inverted by mistake, the indicator reorders them. |
## Advantages / strengths
- It measures a concrete and frequently ignored form of risk, against which the usual protection tool is simply ineffective.
- The decomposition is exact: the two components summed give the total bar return by construction.
- It has an immediate operational bearing on the sizing of positions held past the session.
- It allows comparing different instruments on a risk dimension that overall volatility conceals.
## Limitations and warnings
- On continuously traded markets the value stays structurally low and the indicator adds little information.
- Some brokers build the bar open aligned to the previous close, artificially zeroing the gaps.
- The share is a proportion: it can rise because gaps increase or because intra-bar movement decreases.
- It says nothing about the direction of gaps, which in practice tend to have an instrument dependent asymmetry.
**No repaint:** values printed on a closed bar are never modified afterwards.
**Disclaimer.** This product is a technical analysis tool, not an automated trading system, and it offers no profit guarantee whatsoever. Financial markets carry the risk of total loss of the invested capital. Past performance is not indicative of future results. Every signal must be confirmed with your own analysis, a money management plan and prior testing on a demo account. The author is not responsible for trading decisions taken on the basis of this indicator.
## Suggested tags / keywords for MQL5
`gap risk`, `overnight`, `volatility`, `risk management`, `stocks`, `indices`, `no repaint`, `decomposition`