KD SMC Mini Charts

  • Indicateurs
  • Dien Du Khanh Duong
    Dien Du Khanh Duong
    KD Trading System: Trade with context. Read structure. Confirm across timeframes. Plan the risk.
    ====================================================================================
  • Version: 1.2
  • Mise à jour: 5 octobre 2026
  • Activations: 10

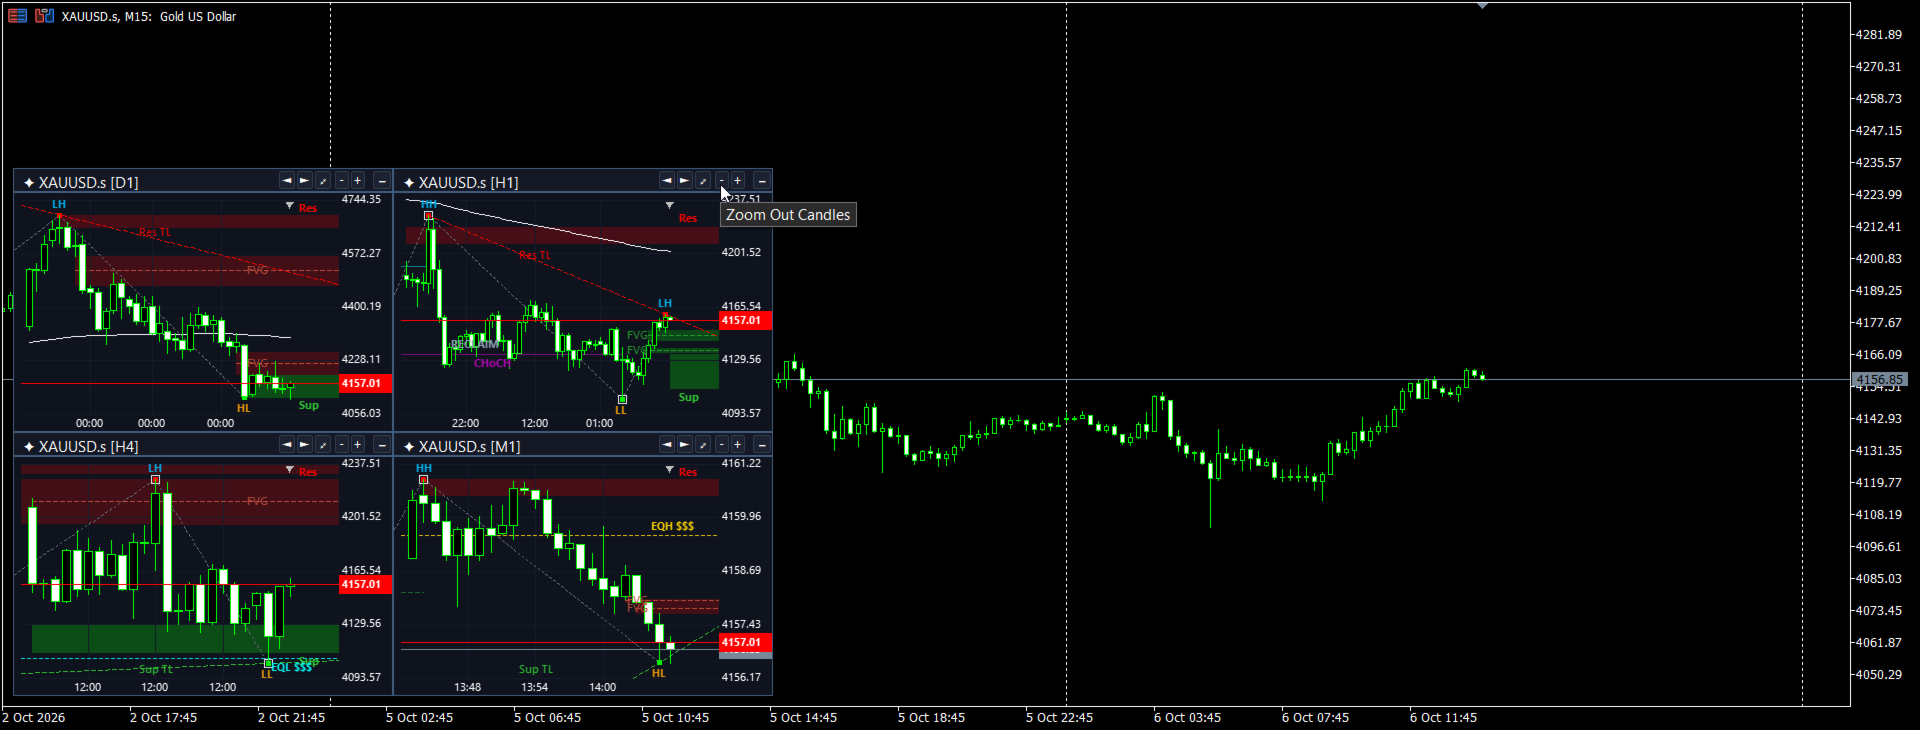
KD SMC MiniCharts is a multi-timeframe analysis tool for MetaTrader 5 that displays up to four synchronized mini charts directly inside your main chart.

Each mini chart can use its own timeframe and display SMC and Price Action information independently. This allows you to monitor lower- and higher-timeframe structure without repeatedly switching the timeframe of your main chart or opening multiple chart windows.

Key Capabilities

1. Up to 4 Multi-Timeframe Mini Charts

Display up to four mini charts inside the active MT5 chart.

For example, you can keep the main chart on M5 while displaying M15, H1, H4, and D1 views alongside it.

Each mini chart slot can be configured independently:

  • Timeframe
  • Window height
  • Chart scale
  • Trade history display

Shared layout controls allow you to adjust the screen corner, container width, spacing, and X/Y position of the mini-chart area.

2. SMC and Price Action Analysis

Each mini chart processes its selected timeframe independently and can display:

  • Market Structure: ZigZag swings, HH / HL / LH / LL labels, Break of Structure (BOS), and Change of Character (CHoCH).
  • Supply & Demand: Order Blocks (OB) and Support / Resistance zones.
  • Fair Value Gaps: FVG areas with optional 50% equilibrium levels.
  • Dynamic Trendlines: Structure-based trendlines calculated from the mini chart timeframe.
  • Liquidity: Liquidity Sweeps with Reclaim detection and Equal Highs / Equal Lows (EQH / EQL).
  • Trend Filter: Configurable slow Exponential Moving Average (EMA), with EMA 200 as the default setting.

This keeps the analysis specific to each mini chart rather than simply copying objects from the main chart.

3. Trade Levels and KD AutoSLTP Synchronization

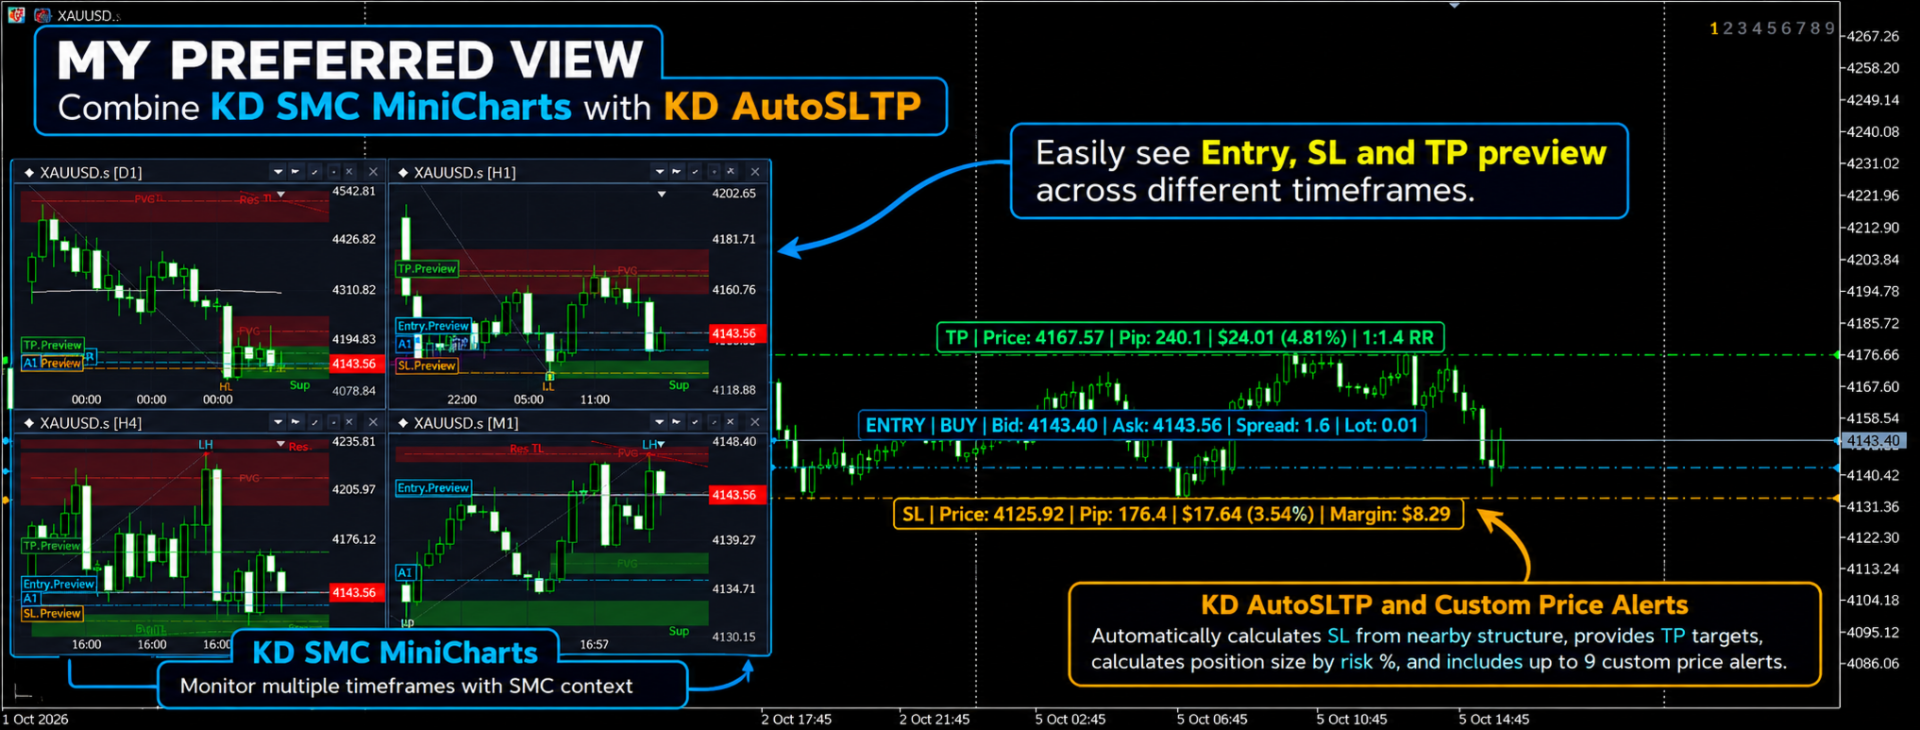
KD SMC MiniCharts can display trading information across the additional timeframe views.

Supported information includes:

  • Position Entry
  • Stop Loss
  • Take Profit
  • Buy / Sell trade markers
  • Bid / Ask lines
  • Trade history

When used together with KD AutoSLTP, Entry, SL, and TP preview levels can also be synchronized with the mini charts.

This makes it possible to adjust the planned levels on the main chart while viewing their location relative to structure on other timeframes.

Practical Multi-Timeframe Workflows

Workflow 1: Comparing Execution and Higher-Timeframe Structure

Keep the main chart on an execution timeframe such as M5 or M15 while using the mini charts for broader context.

For example:

  • Main Chart — M1: Execution view for observing detailed price action and managing entries.
  • Mini Chart 1 — M15: Local structure view for monitoring nearby swings, BOS / CHoCH, FVGs, and short-term Support / Resistance.
  • Mini Chart 2 — H1: Intraday context for comparing the M1 setup with broader market structure, liquidity areas, and directional movement.
  • Mini Chart 3 — H4: Higher-timeframe structure for monitoring major swings, Order Blocks, FVGs, and Support / Resistance areas.
  • Mini Chart 4 — D1: Broad market context for viewing larger price structure and significant higher-timeframe areas.

The lower-timeframe chart remains available for detailed price observation while the mini charts show how the same market is developing across broader timeframes.

This can be useful for comparing local price movement with higher-timeframe swings, structure, Order Blocks, FVGs, and Support / Resistance areas.

Workflow 2: Monitoring Liquidity and Structure Across Timeframes

Use one mini chart to monitor a higher-timeframe area and another to observe lower-timeframe price behavior.

For example, when price approaches an H4 or H1 FVG, Order Block, or structural area, an M15 or M5 mini chart can provide a closer view of:

  • BOS / CHoCH
  • Liquidity Sweeps
  • Reclaim behavior
  • Swing structure
  • Dynamic trendlines

This provides multiple levels of market structure on the same workspace without repeatedly changing the timeframe of the main chart.

Workflow 3: Reviewing SL / TP Levels Across Multiple Timeframes

When used with KD AutoSLTP, planned Entry, Stop Loss, and Take Profit levels can be displayed across the mini charts.

For example, an Entry / SL / TP preview created on the main chart can also be viewed against H1 or H4 structure.

This provides additional visual context for comparing planned trade levels with nearby Support / Resistance, Order Blocks, FVGs, liquidity areas, or other visible market structure before an order is placed.

Works with the KD Trading Suite

KD SMC MiniCharts can be used independently or alongside other KD Trading Suite tools:

  • KD Ultimate SMC: SMC structure, liquidity mapping, imbalance areas, and multi-timeframe analytical context.
  • KD AutoSLTP: Risk-based lot sizing and visual Entry / SL / TP planning, with preview synchronization to the mini charts.
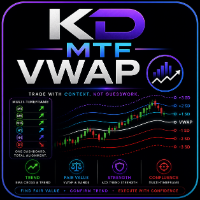
  • KD MTF VWAP: Multi-timeframe VWAP levels and standard-deviation bands.
  • KD MTF Candle Timer: Candle-close countdowns across multiple timeframes.
  • KD HTF Candles: Higher-timeframe candles displayed on lower-timeframe charts.
  • KD MTF Dashboard: Multi-symbol and multi-timeframe market monitoring.

Each tool focuses on a different part of the analysis and trade-planning workflow, so they can be combined according to the user's preferred setup.

Input Parameters

Mini Chart Slots 1–4

  • Target Timeframe: Select the timeframe for each mini chart.
  • Window Height: Set the vertical size of each chart.
  • Chart Scale: Configure the chart zoom level.
  • Show Trade History: Show or hide historical trade markers.

Window and Display Configuration

  • Window Corner & Offsets: Select the screen anchor corner and adjust X/Y offsets.
  • Window Width: Adjust the mini-chart container width.
  • Price & Date Scales: Show or hide price and time scales.
  • Chart Shift & Auto Scroll: Configure the right-side chart margin and scrolling behavior.

SMC Modules

  • ZigZag & Swing Labels: Display structural swings and HH / HL / LH / LL labels.
  • BOS / CHoCH: Display market structure break information.
  • Order Blocks & S/R Zones: Show Order Blocks and Support / Resistance areas.
  • Fair Value Gaps & Trendlines: Display FVG areas and dynamic trendlines.
  • EQH / EQL: Detect Equal Highs and Equal Lows using the configured threshold.
  • Slow EMA: Enable the EMA trend filter and configure its period.

Open Orders and Trade Levels

  • Show Trade Levels: Display Entry, Stop Loss, and Take Profit levels.
  • Show Bid / Ask Lines: Display current Bid and Ask prices.
  • Trade Colors: Configure colors for Buy, Sell, Stop Loss, and Take Profit information.

Support

For configuration questions or technical support, please use the MQL5 product comments or the MQL5 messaging system.
Produits recommandés
Bollinger RSI Momentum Reversal: Precision Signal Indicator Stop chasing every price spike. Most traders lose money because they enter on a Bollinger Band touch without waiting for momentum to shift. The Bollinger RSI Momentum Reversal indicator solves this by requiring a "Double-Lock" confirmation before ever printing a signal. ____________________________________________________________________________________________________________________________________________ How It Works This indicator
FREE
A Média Móvel é um indicador que faz parte da Análise Técnica. Com ela, é possível identificar o equilíbrio dos preços no mercado, observando tendências de alta, neutra ou baixa. Este indicador customizado traz opções extras pera definir o método de cálculo podendo-se esclolher entre SMA,EMA,SSMA,LWMA,JJMA,JurX,ParMA,T3,Vidya,AMA,HULL MA. Também conta com varias opções para escolher o método de cálculo para o preço base a ser usado no cáculo da média.
Prism Scalper
VALU VENTURES LTD
Prism Scalper Basic v16.0 Prism Scalper Basic v16.0 is a sophisticated MetaTrader Expert Advisor designed for high-frequency scalping across multiple markets, including Forex, Gold, and Cryptocurrency. This trading system employs a proven mean reversion strategy to maximize profit potential while maintaining strict risk management protocols. Key Features Single Strategy Focus:   Specialized mean reversion system for clear and consistent performance. Multi-Asset Optimization:   Automatically ada
FREE
Streamline your charts and instantly inspect multi-indicator values without cluttering your workspace. Multi-Indicator HUD displays real-time readings from 8 popular technical indicators directly on your main chart window. Move your mouse across any historical bar to inspect exact indicator values for that specific candle in real time, or let it default to live market ticks. Key Features - Dynamic Mouse Hover: Hover over any past candle to instantly view its historical indicator values. - Cle
Want to make the graph cleaner? Don't you use the opening price in your analysis? Want to use a chart model that was used by Richard Wyckoff? Then you need to know the Color HLC Candles and Bars indicator. In the same indicator you can switch to the display of candles or bars. Take a look at the other volume indicators to complement your operating. And don't forget to look at the best Vwap Custom (Midas)! Leave your comment! Success and good trades!
The   Pure Price Action ICT Tools   indicator is designed for pure price action analysis, automatically identifying real-time market structures, liquidity levels, order & breaker blocks, and liquidity voids. Its unique feature lies in its exclusive reliance on price patterns, without being constrained by any user-defined inputs, ensuring a robust and objective analysis of market dynamics.   MARKET STRUCTURES A Market Structure Shift, also known as a Change of Character (CHoCH), is a pivota
Trade Performance Information
Andres Mauricio Serrano Quintero
This indicator will help you track performance of your trades, even scalping trades.  You can use it with the Arab, and many other traders.  This indicator displays essential trading account information directly on your chart. It positions itself in one of the four corners of the screen and showcases details such as: Symbol: The symbol of the asset currently displayed on the chart. Profit/Loss: The total profit or loss in dollars for the current symbol. Pips: The total number of pips gained or
FREE
BTC Trend Scalper MT5 Trend Capture Edition — Trading de Momentum de Précision pour BTCUSD Bonjour, traders ! Je suis le   BTC Trend Scalper MT5   — un Expert Advisor intelligent pour le trading du Bitcoin, conçu pour capturer les mouvements de momentum avec une gestion des risques disciplinée. Je ne suis   pas   un martingale. Je ne suis   pas   un système en grille. Je ne suis   pas   un robot de jeu. Je suis un   scalpeur suiveur de tendance   construit spécifiquement pour les traders qui c
XAUUSD OrderFlow Structure AutoPOC Pro is an advanced MetaTrader 5 indicator designed to analyze market structure, order flow, buying and selling pressure, liquidity, and volume distribution directly on the chart. The indicator is especially focused on XAUUSD (Gold) analysis, although it can also be used with other instruments available in MetaTrader 5. Its objective is to bring together several analytical tools that would normally require multiple indicators: market structure, BOS and CHOCH, Or
Buy Sell Smart
Syamsurizal Dimjati
BUY and SELL smart The BUY and SELL Smart Indicator is a next-generation trading tool engineered for precision scalpers, intraday strategists, and professional analysts who demand both speed and clarity in market visualization. It seamlessly integrates smart candle-based analytics, adaptive ATR logic, and real-time economic event awareness — giving you a fully synchronized view of market volatility and momentum. Through an elegant and optimized interface, FlashScalp delivers   instant signal fee
Order Book, known also as Market Book, market depth, Level 2, - is a dynamically updated table with current volumes of orders to buy and to sell specific financial instument at price levels near Bid and Ask. MetaTrader 5 provides the means for receiving market book from your broker, but in real time only, without access to its history. The indicator OrderBook Cumulative Indicator accumulates market book data online and visualizes them on the chart. In addition, the indicator can show the market
Volume Waves
Paulo Henrique Faquineli Garcia
One of the best tools for analyzing volume, Weis Wave was devised by David Weis to facilitate reading the directional flow. For the disciples of the Wyckoff method, this means an evolution, facilitating a predictive reading of the market, always looking for Accumulation and Distribution zones for traded assets. For better understanding, in this indicator we try to cover every reading of EFFORT (traded volume) versus RESULT (price change). Thus, you can apply the indicator on the chart twice to
Please Check All Of Our Products: LINK News Filter Dashboard – Economic Calendar Indicator for MT5 The News Filter Dashboard is a powerful MQL5 indicator designed to help traders monitor economic news events directly on the MetaTrader 5 chart . This indicator provides a visual news dashboard that displays the latest and upcoming economic news for 8 major currencies , allowing traders to stay informed and manage risk during volatile market conditions. The dashboard clearly shows the event name,
BlinkBreakout EA
Dariia Sinielnik
BlinkBreakout EA is a professional automated trading system for MetaTrader 5 that trades breakouts of session ranges (London/New York) with dynamic ATR-based risk management. The EA identifies the consolidation range at the start of a user-defined session, then automatically enters when price breaks the High or Low. Every trade uses a hard Stop Loss calculated from current market volatility (ATR), with optional Take Profit, Break-Even, and Trailing Stop functions. Key features: • Session-based
Back Test: Sharp Ratio 2.05;Return 220% 2025; Please check the live signal Easy Automated Trading for AUDCAD This Expert Advisor is designed for traders who want a simple, automated, and hands-free trading system on AUDCAD . No complicated indicators. No manual trade management. Just attach the EA to the chart and let it work. How the EA Trades Works only on AUDCAD (focused and optimized) Trades both BUY and SELL automatically Uses a smart grid system to enter the market gradually Optiona
FREE
Apex Heikin Ashi Pro V1.0 , développé par M. Brijesh Jaiswal, est un indicateur de tendance Heikin Ashi premium pour MT5. Il propose des flèches d'achat/vente sans repeinte (non-repaint), une confirmation SuperTrend, des couleurs de bougies royales, un style de graphique sombre, des notifications d'alerte et un tableau de bord professionnel pour une lecture rapide de la tendance. Apex Heikin Ashi Pro est conçu pour les traders qui recherchent une méthode plus claire pour identifier la direction
Crypto dragon MT5
Efren Hernandez Partida
Crypto Dragon MT5 Crypto Dragon MT5 est conçu pour trader automatiquement sur les marchés des cryptomonnaies, grâce à une stratégie axée sur la valorisation des périodes de forte volatilité. Crypto Dragon MT5 ouvre des ordres d'achat lorsque le marché atteint un certain niveau de volatilité et, si le prix continue d'évoluer à la baisse, utilise un système de lissage à la baisse avec de nouveaux ordres jusqu'à ce que le nombre maximal d'ordres, fixé à 10, soit atteint. Si la marge disponible p
CurvedSmoothChannel_Enhanced - Enhanced Price Channel Indicator **CurvedSmoothChannel_Enhanced** is a powerful and visually appealing price channel indicator designed for MetaTrader 5 that helps you identify trends, potential reversals, and key price levels with precision. This enhanced version combines the power of the Hull Moving Average (HMA) and John Ehlers' Super Smooth Filter, creating a dynamic, adaptive channel that adjusts to market conditions across multiple time frames. #### Key Fea
CVD divergences
Kettani abdouessalam
Real CVD Light plots Cumulative Volume Delta as candles (Open / High / Low / Close) in a separate window. It is built tick by tick from real trade data, and it detects divergences between price and CVD. What it does Builds CVD candles from real tick flags (BUY / SELL) and real trade volume. Updates incrementally on every tick, so the live candle stays fast and accurate. Detects confirmed pivots on price (fractal highs and lows) and compares them with the CVD at the same pivots. Finds four types
Heiken Ashi Smoothwave
Alexandre Vincent Traber
Aperçu Heiken Ashi Smoothwave transforme votre graphique en bougies Heiken Ashi lissées directement dans la fenêtre principale du graphique, remplaçant les bougies standard pour une vue de tendance plus claire. Pas de fenêtre séparée, pas d'encombrement. Fonctionnement Calcule les valeurs OHLC Heiken Ashi à partir des données de prix réelles sur chaque bougie. Trace des bougies Heiken Ashi colorées directement sur le graphique principal. Masque automatiquement les bougies natives du graphique,
FREE
Introducing the Boom and Crash Indices Killer EA for MT5 Welcome to the next evolution in trading with the Boom and Crash Indices Killer EA, specifically designed for MetaTrader 5 (MT5). This expert advisor (EA) is engineered to trade Boom and Crash indices with unparalleled precision, leveraging advanced price action strategies. Here’s a comprehensive overview of what makes this EA a must-have tool for traders looking for consistent profitability and robust performance. Key Features and Benefit
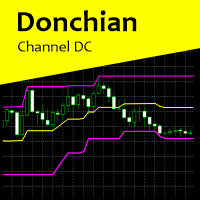
Donchian Channel DC is the indicator of Donchian Channels, that plots maximum and minimum values of a specific period, besides mean value line. It´s possible to configure simple period for analysis and the indicator will plot all three values. You can trade with this indicator as trend or reversal, according to each strategy. Do not let to test others indicators as soon as others expert advisors.
ImbalanceFVG
Taras Demianenko
FVG — finds price gaps on the chart and scores each one for quality. The grade measures risk, and it measures it well. Stop-out rates run 25% / 35% / 60% / 74% for grades A / B / C / D respectively — consistently, across all pairs and all measurements. A grade A zone survives three times as often as a grade D zone. Scoring — four axes , each with its own set of points: Displacement — the strength of the impulse candle: the share of the body in its range, the size relative to ATR, the agreement o
Renko + ATR Trend Envelope PRO+ (Non-Repainting) Renko + ATR Trend Envelope PRO+ is a clean trend-filter indicator that combines a Renko-style step histogram with an ATR-based trend envelope. It highlights trend direction, volatility expansion/contraction and trend reversals with arrows and optional alerts. This tool is ideal for: Trend following strategies Breakout confirmation Filtering false entries during choppy markets Visualizing volatility using ATR envelopes Key Features Renko-Style Hi
GodScalper EA Product Designation: GodScalper Enterprise Edition Asset Classes: Gold (XAUUSD), Major Currency Pairs (EURUSD, GBPUSD), Equity Indices (US30, NAS100) Execution Frequency: High-Frequency Intraday / Micro-Scalping Access Fee: $4,800 USD (Lifetime Perpetual License | Limited Operational Slots) Product Positioning & Valuation Rationale GodScalper is an institutional-grade automated trading system engineered specifically for capital preservation, extreme execution speed, and high-probab
Weis Wave Scouter
Jean Carlos Martins Roso
Découvrez la puissance de l'analyse avancée du volume avec le Weis Wave Scouter, un indicateur révolutionnaire pour MetaTrader 5 combinant les principes éprouvés de la méthode Wyckoff et de l'analyse VSA (Volume Spread Analysis). Conçu pour les traders recherchant précision et profondeur, cet indicateur fournit une lecture tactique du marché via l'analyse des vagues de volume cumulatif, aidant à identifier les points clés de retournement et de continuation de tendance. Le Weis Wave Scouter propo
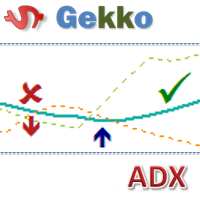
This is Gekko's Cutomized Cutomized Average Directional Index (ADX), a customized version of the famous ADX indicator. Use the regular ADX and take advantage two entry signals calculations and different ways of being alerted whenever there is potential entry or exit point. Inputs Period: Period for the ADX calculation; PlotSignalType: How will the indicator calculate entry (swing) signals: 1- ShowSwingsOnTrendLevel : Show Signals for Trend Confirmation Swings; 2- ShowSwingsOnTrendLevelDirection
Volume Pressure Pro
Wojciech Jerzy Magda
Volume Pressure Pro See who really controls the market — before the move becomes obvious. Most indicators show you where price has been . Volume Pressure Pro shows you who is winning the battle right now — buyers or sellers. This is not another repainted RSI or MACD clone. It is a proprietary algorithm built from scratch, and its formula remains a trade secret — which is exactly why its signals look like nothing else on your chart. What you get Clear BUY/SELL signals — a green arrow to buy
MarketX Dashboard
Alexandre Vincent Traber
4 (1)
Overview MarketX Dashboard est un puissant indicateur d'analyse de marché tout-en-un pour MetaTrader 5. Conçu pour les traders qui veulent comprendre la structure, le régime et le comportement statistique de n'importe quel instrument avant de placer un seul trade — le tout dans une interface propre à onglets directement sur votre graphique. Pas d'encombrement. Pas de bruit. Juste le marché. La plupart des traders utilisent des indicateurs pour trouver des points d'entrée. MarketX Dashboard répon
FREE
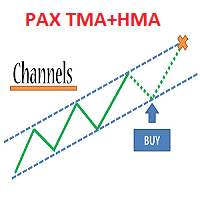
Trade system "PAX Multi TMA/HMA 8" for MT5 It is a ready-made trading system for trading on any instrument and any timeframe. Completely ready for manual trading and use in robots. Not redrawn signals ( See the picture ) It is convenient to work on any timeframe. Tested on metals, currency pairs, oil, international stocks, Russian stocks, cryptocurrencies, monetary and cryptocurrency indices. What the trading system consists of: 1. The main channel of price movement named Medina. May b
Les acheteurs de ce produit ont également acheté
Trend Sniper X
Sarvarbek Abduvoxobov
4.86 (44)
Trend Sniper X est un indicateur de suivi de tendance multi-unités de temps pour MetaTrader 5 qui aide les traders à identifier la direction de la tendance et les points d'inversion potentiels avec clarté et précision. pour MT4: https://www.mql5.com/en/market/product/193245 Informations sur le prix : Le prix actuel est un prix promotionnel et est susceptible de changer lors des prochaines mises à jour et nouvelles fonctionnalités. Offre bonus : Pour obtenir GRATUITEMENT l'Auto-Trade Assistant E
Un nouveau Roi en ville - Indicateur + Gestion des ordres (TP1 + TP2 + TP3) + Envoi optionnel de signaux Telegram INCLUS (GRATUIT) (SYSTÈME COMPLET DE TRADING et DE SIGNAUX) Notre meilleur EA pour l’Or : Gold Slayer Cet indicateur inclut une stratégie avancée, un système de trading avec gestion des ordres personnalisable ainsi qu’un système de retour à la moyenne combinant des extensions d’enveloppes, soutenu par plusieurs filtres intelligents de confirmation comme le RSI afin de détecter des en
Smart Trend Trading System — MetaTrader 5 Après votre achat, envoyez-moi un message sur MQL5 pour recevoir GRATUITEMENT Smart Universal Expert Advisor, ainsi que le cours en ligne, le manuel PDF et l’accès au groupe privé. STTS réunit la direction de la tendance, les signaux d’entrée et de sortie, les zones de retournement et les niveaux de prix importants directement sur votre graphique. Suivez le système manuellement ou connectez un EA compatible distinct pour une exécution automatique selon l
Entry Points Pro vous montre où entrer, où placer le stop et avec quel lot trader — avant que vous ne passiez l'ordre. PRIX Actuellement 199 USD : 8 exemplaires à ce prix, ensuite 249 USD. Le prix final est de 349 USD. Je gagne ma vie en tradant sur les marchés, et je le montre, donc je n'ai pas besoin de vendre cet indicateur à tout le monde. C'est un outil pour les traders qui réfléchissent par eux-mêmes, pas un bouton magique. Pas de cassure, pas de trade. Une flèche grise est un signal annu
Gann Made Easy   est un système de trading Forex professionnel et facile à utiliser qui est basé sur les meilleurs principes de trading en utilisant la théorie de mr. WD Gann. L'indicateur fournit des signaux d'ACHAT et de VENTE précis, y compris les niveaux Stop Loss et Take Profit. Vous pouvez échanger même en déplacement en utilisant les notifications PUSH. VEUILLEZ ME CONTACTER APRÈS L'ACHAT POUR RECEVOIR GRATUITEMENT DES INSTRUCTIONS DE TRADING ET D'EXCELLENTS INDICATEURS SUPPLÉMENTAIRES! V
SuperScalp Pro
Van Minh Nguyen
4.54 (37)
SuperScalp Pro - Professional Multi-Layer Confluence Scalping System SuperScalp Pro est un indicateur de scalping avancé qui améliore le Supertrend classique grâce à plusieurs filtres intelligents de confirmation. Il vous aide à identifier des opportunités de trading Buy/Sell présentant une probabilité de réussite plus élevée, tout en réduisant considérablement les faux signaux. Des flèches Buy et Sell bien visibles apparaissent directement sur le graphique, avec des niveaux de Stop Loss et de T
Ultra Indicator
Ihor Otkydach
5 (1)
ULTRA est un indicateur technique « tout-en-un » : il analyse le marché de manière autonome, génère des signaux de trading, affiche les niveaux permettant de définir des ordres stop-loss et suggère le moment opportun pour clôturer les positions afin de sécuriser les bénéfices ou de minimiser les pertes. En d'autres termes, peu importe que vous ne sachiez pas analyser le marché, déterminer les niveaux (où placer votre stop-loss) ou que vous ayez du mal à gérer votre capital. ULTRA s'occupera de t
Boba Analysis Suite
Trade Ready Solutions LLC
5 (2)
Boba Analysis Suite Boba Analysis Suite est un indicateur d’analyse pour MetaTrader 5. Il réunit la structure du marché, les zones de prix pertinentes et le contexte général du marché dans une même vue graphique. Développé à partir de l’expérience pratique d’un trader et formateur en trading, il accompagne une démarche d’analyse structurée : évaluer la direction du marché, identifier les niveaux importants et analyser plusieurs unités de temps conjointement. Une analyse en contexte La significat
FX Power MT5 NG
Daniel Stein
5 (33)
FX Power : Analysez la force des devises pour des décisions de trading plus intelligentes Aperçu FX Power est l'outil essentiel pour comprendre la force réelle des principales devises et de l'or, quelles que soient les conditions du marché. En identifiant les devises fortes à acheter et les faibles à vendre, FX Power simplifie vos décisions de trading et révèle des opportunités à forte probabilité. Que vous suiviez les tendances ou anticipiez les retournements à l'aide de valeurs extrêmes de D
M1 Sniper MT5
Oleg Rodin
5 (7)
M1 SNIPER   est un système d'indicateurs de trading facile à utiliser. Il s'agit d'un indicateur à flèche conçu pour l'unité de temps M1. Cet indicateur peut être utilisé seul pour le scalping sur l'unité de temps M1 ou intégré à votre système de trading existant. Bien que conçu spécifiquement pour le trading sur l'unité de temps M1, ce système peut également être utilisé avec d'autres unités de temps. Initialement, j'avais conçu cette méthode pour le trading du XAUUSD et du BTCUSD. Cependant, j
FiboSniper Pro
Van Minh Nguyen
5 (4)
FiboSniper Pro – Multi-Filter Fibonacci System with Auto SL/TP and Control Panel FiboSniper Pro est un indicateur technique qui combine des Fibonacci Envelopes dynamiques avec plusieurs filtres de confirmation afin de générer des signaux Buy et Sell sélectionnés. Les niveaux de Fibonacci sont calculés à partir de Moving Average et ATR, puis filtrés par ADX, EMA, RSI, ATR, Volume, Time et la structure des bougies. L’indicateur affiche directement sur le graphique les niveaux automatiques de Stop
Apex Patterns PRO Achetez l'indicateur - Obtenez GRATUITEMENT l'Expert Advisor basé sur celui-ci. Intelligence auto-optimisée des figures chartistes et des cassures Les scanners de figures traditionnels s'appuient sur des paramètres fixes, sous-performant souvent lorsque la volatilité et les structures du marché changent. Apex Patterns PRO est conçu pour s'adapter aux conditions changeantes du marché en combinant la reconnaissance des figures chartistes structurelles, le filtrage du momentum et
Auto Optimized SpeedAngle est un système de vectorisation du momentum de niveau institutionnel qui élimine l'ajustement de courbe ( curve-fitting ) grâce à une optimisation continue par avancement ( Walk-Forward Optimization , WFO). Plutôt que de s'appuyer sur des entrées statiques qui se dégradent lorsque les régimes de marché changent, l'indicateur recalibre dynamiquement ses paramètres en utilisant une validation hors échantillon ( Out-of-Sample , OOS), garantissant ainsi que les signaux affi
SQN Max indicator for MT5 by ITC
Renaud Herve Francois Candel
Sqn Max Indicator Sqn Max is an exclusive indicator to trade the market with high effectiveness. The indicator is based on price action, volatility and trend. This indicator is as simple as possible but not too simple. The indicator can generate alerts to ease the trading process. You don't have to stay all day in front of your screen. The indicator can be used with any class of assets and with any time frame. It is possible to achieve better results trading our list of selected assets. We achi
Prochaine mise à jour — Version 2.52 bientôt disponible ! [NOUVEAU] Préparez-vous à découvrir 4 nouvelles fonctionnalités majeures conçues pour améliorer votre analyse du marché et votre flux de travail de trading Nous faisons passer l’analyse du marché au niveau supérieur avec 4 nouvelles fonctionnalités conçues pour répondre à vos besoins en trading. Découvrez : 1. TRADE OVERVIEW DASHBOARD 2. CONFLUENCE AT ZONE 3. STRONG & WEAK HIGH/LOW 4. OTE 1. TRADE OVERVIEW DASHBOARD Un tableau de bord qu
Divergence Bomber
Ihor Otkydach
4.89 (94)
Chaque acheteur de cet indicateur reçoit également gratuitement : L’outil exclusif « Bomber Utility », qui accompagne automatiquement chaque opération de trading, fixe les niveaux de Stop Loss et de Take Profit, et clôture les positions selon les règles de la stratégie Des fichiers de configuration (set files) pour adapter l’indicateur à différents actifs Des set files pour configurer le Bomber Utility selon différents modes : « Risque Minimum », « Risque Équilibré » et « Stratégie d’Attente »
Power Candles MT5
Daniel Stein
4.58 (12)
Power Candles V3 - Indicateur de force à optimisation automatique Power Candles V3 transforme la force des devises et des instruments en un plan de trading exploitable sur chaque graphique auquel il est associé. Au lieu de se contenter de colorer les bougies, il effectue une optimisation automatique en temps réel en arrière-plan et vous fournit les meilleurs niveaux de Stop Loss, Take Profit et seuils de signal pour le symbole que vous avez sous les yeux. Un simple clic suffit pour l'adopter en
Currency Strength Wizard   est un indicateur très puissant qui vous offre une solution tout-en-un pour un trading réussi. L'indicateur calcule la puissance de telle ou telle paire de devises en utilisant les données de toutes les devises sur plusieurs périodes. Ces données sont représentées sous la forme d'un indice de devise facile à utiliser et de lignes électriques de devise que vous pouvez utiliser pour voir la puissance de telle ou telle devise. Tout ce dont vous avez besoin est d'attacher
Astral Structure
Ottaviano De Cicco
Astral Structure Évaluez la configuration. Consultez le plan initial. Offre de lancement - $99. $149 après le lancement. Une configuration de structure soulève plusieurs questions : la vue plus large concorde-t-elle, où se situe la référence de stop et comment les objectifs sont-ils définis ? Astral Structure réunit ces questions dans un espace de travail pour les traders discrétionnaires qui fondent leurs décisions sur la structure du marché. Concentrez-vous sur la configuration pertinente. Exa
Indicateur multi-devises de force et de momentum MT5 Dynamic Forex28 Navigator est l'évolution de nos indicateurs populaires de longue date, qui réunit la puissance de cinq en un : Advanced Currency Strength28 Indicator (700 avis) Advanced Currency IMPULSE with ALERT (530 avis) Currency Strength EXOTICS GOLD Impulse with Alert CS28 Combo Signals (bonus actuel) Pas besoin d'acheter quatre indicateurs et de les empiler sur vos graphiques. Tout est réuni dans un seul indicateur puissant : la force
Scalper Vault est un système de trading puissant et complet, conçu pour les traders en quête de régularité dans le cadre du trading intrajournalier. Cet indicateur de haute précision constitue un système de trading autonome et exhaustif, offrant des analyses de qualité institutionnelle, aussi bien pour le Forex que pour les options binaires. VEUILLEZ ME CONTACTER APRÈS VOTRE ACHAT POUR OBTENIR MES CONSEILS DE TRADING AINSI QU'UN EXCELLENT BONUS ! En éliminant les incertitudes et les analyses man
Le même graphique, lu dans le même ordre, chaque jour. La structure, la zone la plus proche, votre position dans le range et le côté de la tendance — à l'écran immédiatement, toujours sous la même forme. BONUS POUR LES ACHETEURS — SMC Nexus Scanner Pro. Un scanner multi-symboles fondé sur les données de cet indicateur : un seul panneau affiche le côté de la tendance, les order blocks actifs et les BOS / CHoCH de nombreux symboles à la fois. Sans supplément — après votre achat, envoyez-moi un me
Azimuth Pro
Ottaviano De Cicco
5 (7)
Azimuth Pro V2: Synthetic Fractal Structure and Confirmed Entries for MT5 Overview Azimuth Pro is a multi-level swing structure indicator by Merkava Labs . Four nested swing layers, swing-anchored VWAP, ABC pattern detection, three-timeframe structural filtering, and closed-bar confirmed entries — one chart, one workflow from micro-swings to macro-cycles. This is not a blind signal product. It is a structure-first workflow for traders who care about location, context, and timing. Halloween P
ARICoins
Temirlan Kdyrkhan
ARICoin is a powerful trading companion designed to generate high-probability entry signals with dynamic TP/SL/DP levels based on volatility. Built-in performance tracking shows win/loss stats, PP1/PP2 hits, and success rates all updated live. Key Features: Buy/Sell signals with adaptive volatility bands Real-time TP/SL/DP levels based on ATR Built-in MA Filter with optional ATR/StdDev volatility Performance stats panel (Success, Profit/Loss, PP1/PP2) Alerts via popup, sound, push, or email Cust
Adaptive Price Action Engine Achetez un indicateur, obtenez l'EA gratuitement Analyse auto-optimisée des tendances et des figures de chandeliers Multi-Timeframe Les marchés évoluent constamment, et tous les modèles de Price Action n’ont pas la même valeur dans toutes les conditions de marché. Adaptive Price Action Engine a été conçu pour s’adapter aux changements du marché en combinant structure de tendance, analyse Multi-Timeframe, figures de chandeliers et optimisation statistique au sein d’un
FX Trend MT5 NG
Daniel Stein
5 (6)
FX Trend NG : La Nouvelle Génération d’Intelligence de Tendance Multi-Marchés Vue d’ensemble FX Trend NG est un outil professionnel d’analyse de tendance multi-timeframe et de surveillance des marchés. Il vous permet de comprendre la structure complète du marché en quelques secondes. Au lieu de naviguer entre de nombreux graphiques, vous identifiez immédiatement quels instruments sont en tendance, où le momentum s’affaiblit et où plusieurs unités de temps sont alignées. Offre de Lancement – Ob
PZ Swing Trading MT5
PZ TRADING SLU
5 (5)
Protect against whipsaws: revolutionize your swing trading approach Swing Trading is the first indicator designed to detect swings in the direction of the trend and possible reversal swings. It uses the baseline swing trading approach, widely described in trading literature. The indicator studies several price and time vectors to track the aggregate trend direction and detects situations in which the market is oversold or overbought and ready to correct. [ Installation Guide | Update Guide | Tro
FX Volume MT5
Daniel Stein
4.79 (24)
FX Volume : Découvrez le Sentiment du Marché tel que perçu par un Courtier Présentation Rapide Vous souhaitez faire passer votre approche de trading au niveau supérieur ? FX Volume vous fournit, en temps réel, des informations sur la manière dont les traders particuliers et les courtiers sont positionnés—bien avant la publication de rapports retardés comme le COT. Que vous visiez des gains réguliers ou recherchiez simplement un avantage plus solide sur les marchés, FX Volume vous aide à repére
Crystal Heikin Ashi Signals
Muhammad Jawad Shabir
5 (5)
Crystal Heikin Ashi Signals—Professional Trend & Signal Detection Indicator Advanced Heikin Ashi Visualization with Intelligent Signal System for Manual & Automated Trading Final Price: $149 ---------> Price goes up $10 after every 10 sales . Limited slots available — act fast . Overview User Guide PDF Crystal Heikin Ashi Signals is a professional-grade MetaTrader 5 indicator that combines pure Heikin Ashi candle visualization with an advanced momentum-shift detection system. Designed for both m
Advance AI Scanner
Mohamed Samsudeen
5 (1)
Advance AI Scanner is a multi-symbol analysis indicator for MetaTrader 5. It scans Forex pairs, metals, energy, stock indices and cryptocurrencies at the same time and rates each instrument with its own self-training model. It explains in plain English what moved each market and why, and it estimates how far upcoming economic news usually moves each symbol, measured on your broker's own price history. $199 instead of $499. 10 copies left at this price. One time purchase  Installation and User
Plus de l'auteur
KD HTF Candles
Dien Du Khanh Duong
KD HTF Candles projects transparent higher-timeframe candle bodies and wicks (e.g. M15/H1) directly onto your lower-timeframe chart, allowing you to view higher-timeframe candlestick patterns while trading a lower timeframe. Reviewing a higher-timeframe candle typically requires switching charts, which can interrupt focus on the execution timeframe. This tool displays the higher-timeframe candle directly on the lower-timeframe chart. Key Features Transparent HTF Overlay: Semi-transparent higher-
FREE
KD Mtf VWAP
Dien Du Khanh Duong
KD MTF VWAP is a Volume Weighted Average Price (VWAP) indicator for MetaTrader 5, designed for lower-timeframe traders (M1, M5, M15) and intraday momentum trading. It projects multi-timeframe Anchored VWAPs, 3-Tier Standard Deviation Bands (±1σ, ±2σ, ±3σ), EMA trend filters, and a Sigma & Pip Distance HUD onto a single chart. VWAP is a benchmark commonly referenced in institutional and algorithmic trading. Combining multi-timeframe VWAP projections with standard deviation bands can help identify
KD MTF Candle Timer — Multi-Timeframe Candle Countdown & Synchronized Clocks for MetaTrader 5 Have you ever entered a trade prematurely on the lower timeframe, only to watch a Higher Timeframe (H1 or H4) candle wick violently against you before closing as a rejection pinbar? Or entered right before the candle close and suffered severe slippage during the transition? In discretionary trading and prop firm challenges, entry timing relative to candle closure is just as critical as your price level
FREE
KD MTF Dashboard
Dien Du Khanh Duong
KD MTF Dashboard displays ADX, RSI, MACD and EMA trend readings for the current chart's symbol across any combination of timeframes from M1 to D1 (up to 6 at once, M1/M5/M15/H1 by default), in a single table. It is designed to show whether a symbol's timeframes agree with each other, without needing to switch between charts. Key Features Multi-Timeframe Indicator Table: Displays ADX(14), RSI(14), MACD Main/Signal comparison, and EMA(20)/EMA(200) comparison for the current symbol, one column per
FREE
KD Ultimate SMC
Dien Du Khanh Duong
KD Ultimate SMC is an automated institutional order-flow indicator for MetaTrader 5, designed to map market structure — BOS/CHoCH shifts, Order Blocks, Fair Value Gaps and Liquidity Pools — across multiple timeframes on a single chart. It is intended as the structural reference the other six tools in the KD Trading System are designed to work alongside. This structure map is intended to serve as a reference point for other tools in the system — including VWAP reactions, mini-chart confirmations
KD Auto SLTP and Custom Price Alerts is a trade planning and risk management indicator for MetaTrader 5. It calculates Stop Loss levels from nearby swing structure, provides multiple Take Profit methods, calculates position size according to a selected percentage of account balance, and includes up to nine user-defined price alert lines. The indicator uses a configurable ZigZag structure engine together with an Average True Range (ATR) buffer to determine structural Stop Loss levels. Swing struc
KD Trade Panel
Dien Du Khanh Duong
KD Trade Panel — Precision Trade Execution & Dynamic Risk Management for MetaTrader 5 Have you ever missed a high-probability trade setup because you spent precious seconds calculating your position size manually? Or worse, suffered an accidental drawdown breach on your prop firm account due to a miscalculated lot size or a delayed stop loss placement? In fast-moving financial markets, execution latency and manual calculation errors are among the primary causes of avoidable trading losses.   KD
Filtrer:
Aucun avis
Répondre à l'avis