Position Tool Visualizer
- Utilitaires
- Version: 1.20
- Mise à jour: 20 avril 2026
- Activations: 5
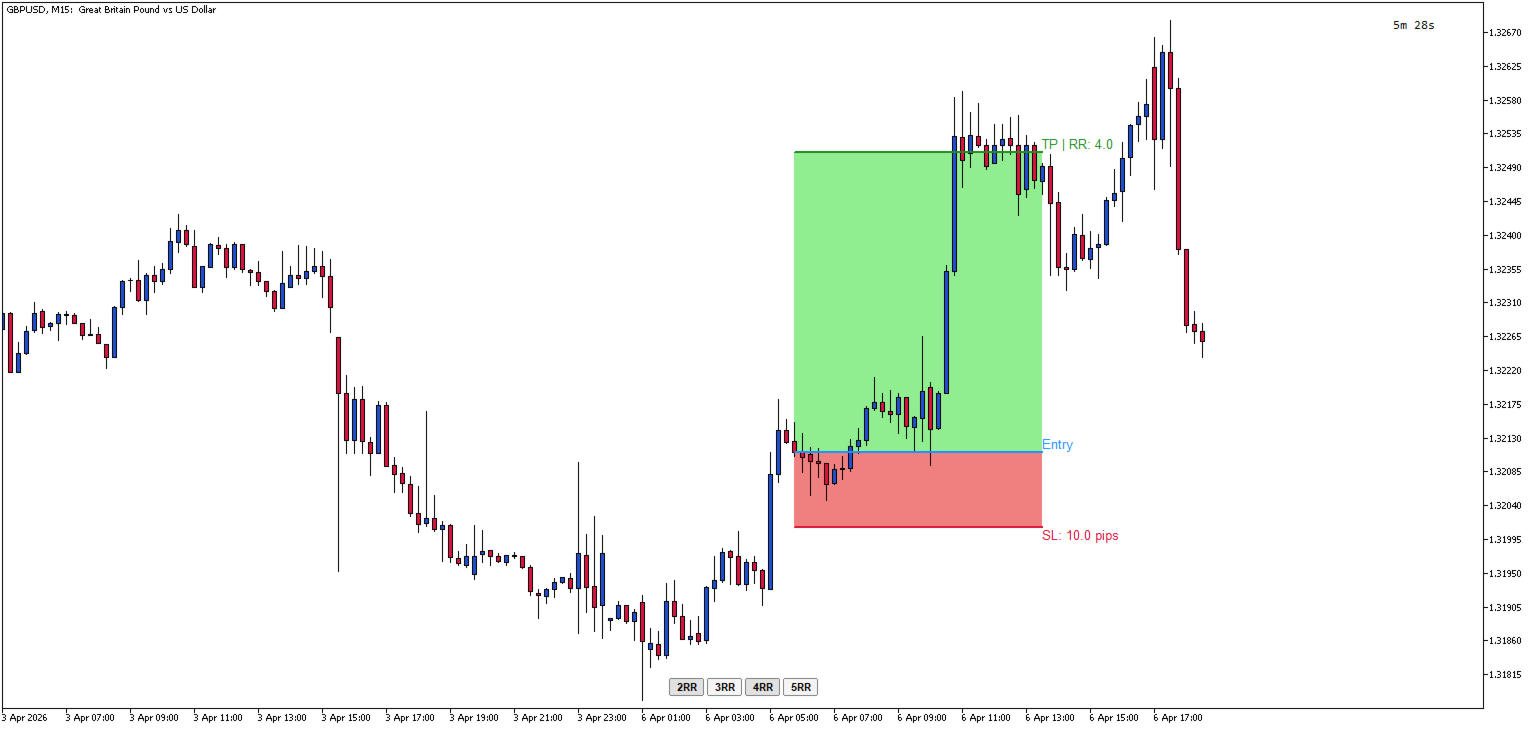
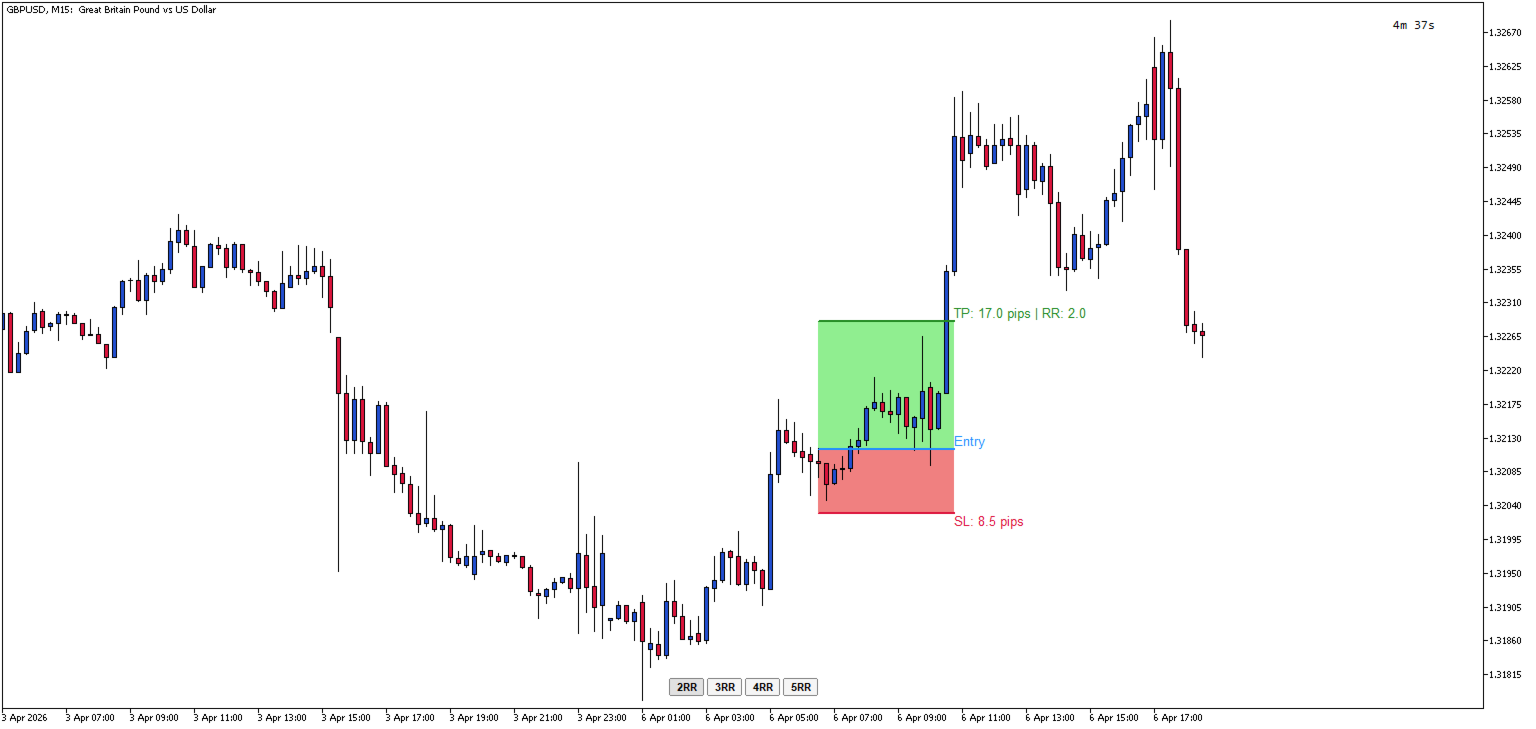
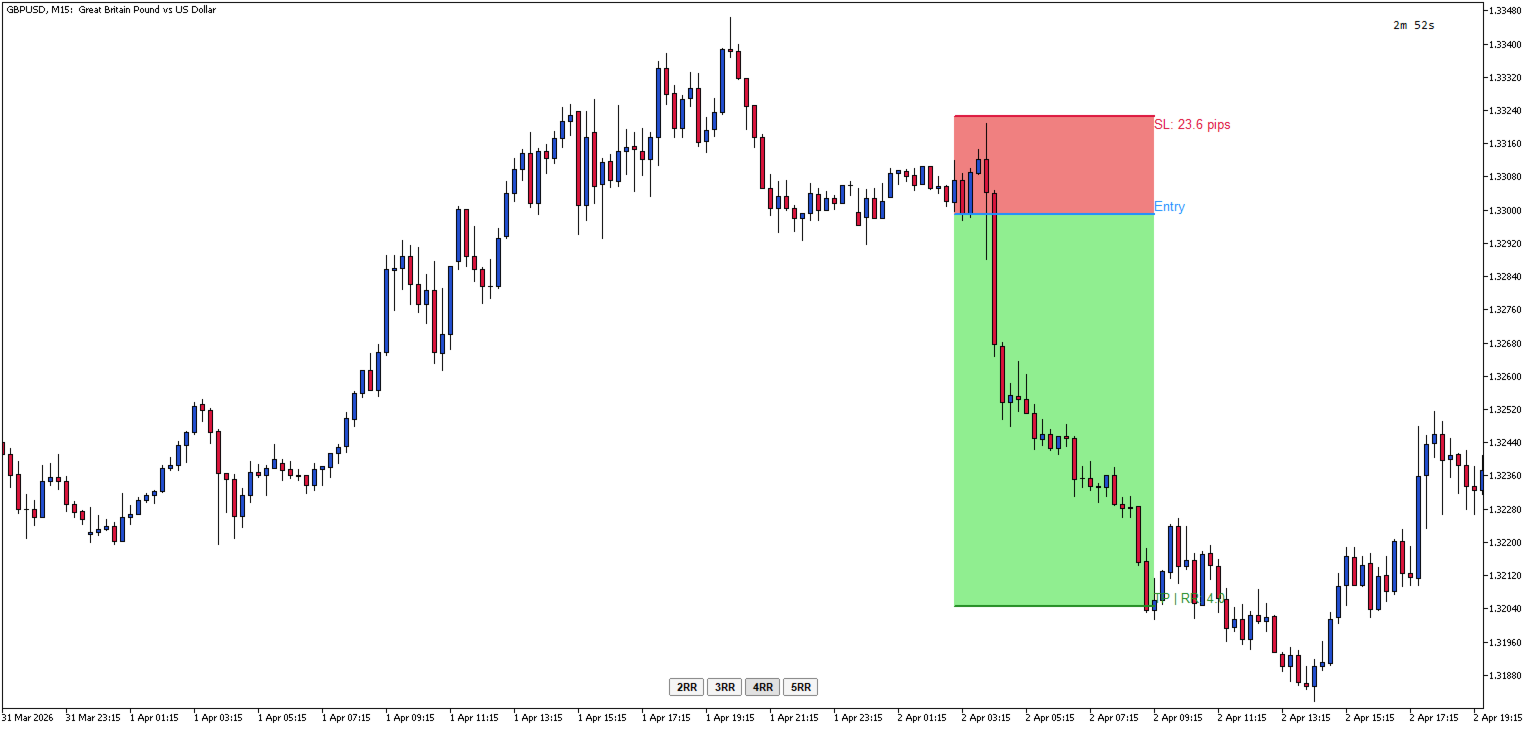
Position Tool Visualizer is a visual trading utility for MetaTrader 5 that helps traders plan and manage their risk-reward ratios directly on the chart. The tool provides three draggable horizontal lines for Entry, Stop Loss, and Take Profit levels, along with filled rectangles showing the risk and reward zones.
Key Features:
- Three Draggable Lines — Entry (blue), Stop Loss (red), and Take Profit (green) lines that can be moved freely on the chart
- Automatic RR Calculation — Displays the risk-reward ratio in real-time as you adjust the levels
- Pip Distance Display — Shows the distance in pips from entry to SL and TP levels
- Quick RR Buttons — One-click buttons to set TP to 1x, 2x, 3x, 4x, or 5x the SL distance
- Multiple Positions — multiple positions can be added simultaneously using the Shortcut 'A'
- Smart Line Behavior — Moving the Entry line automatically moves SL and TP together to maintain their relative distances
- Automatic SL/TP Swap — If you drag SL above Entry (or TP below Entry), the tool automatically swaps to the opposite side
- Visual Zones — Filled rectangles show the risk zone (red) and reward zone (green) between Entry and SL/TP
- Hotkey Toggle — Press the hotkey (default: 'L') to show/hide all lines and buttons instantly
- ESC Hide — Press ESC to toggle visibility while keeping the lines stored
- Persistent Price Memory — Lines remember their positions when hidden and restored
- Horizontal Lock — Lines automatically stay horizontal when dragged
How to Use:
- When indicator is first added to the chart, nothing will be displayed until you toggle it
- Press 'L' (or your configured hotkey) to create the RR tool on your chart / Press 'A' to add another position
- Drag the Entry line to your desired entry price
- Drag the SL line to set your stop loss — the TP will automatically adjust if needed
- Use the 2RR, 3RR, 4RR, or 5RR buttons to quickly set your take profit at a specific risk-reward ratio or manually drag the TP to the required price
- Press 'L' again to remove the tool, or press ESC to hide it temporarily
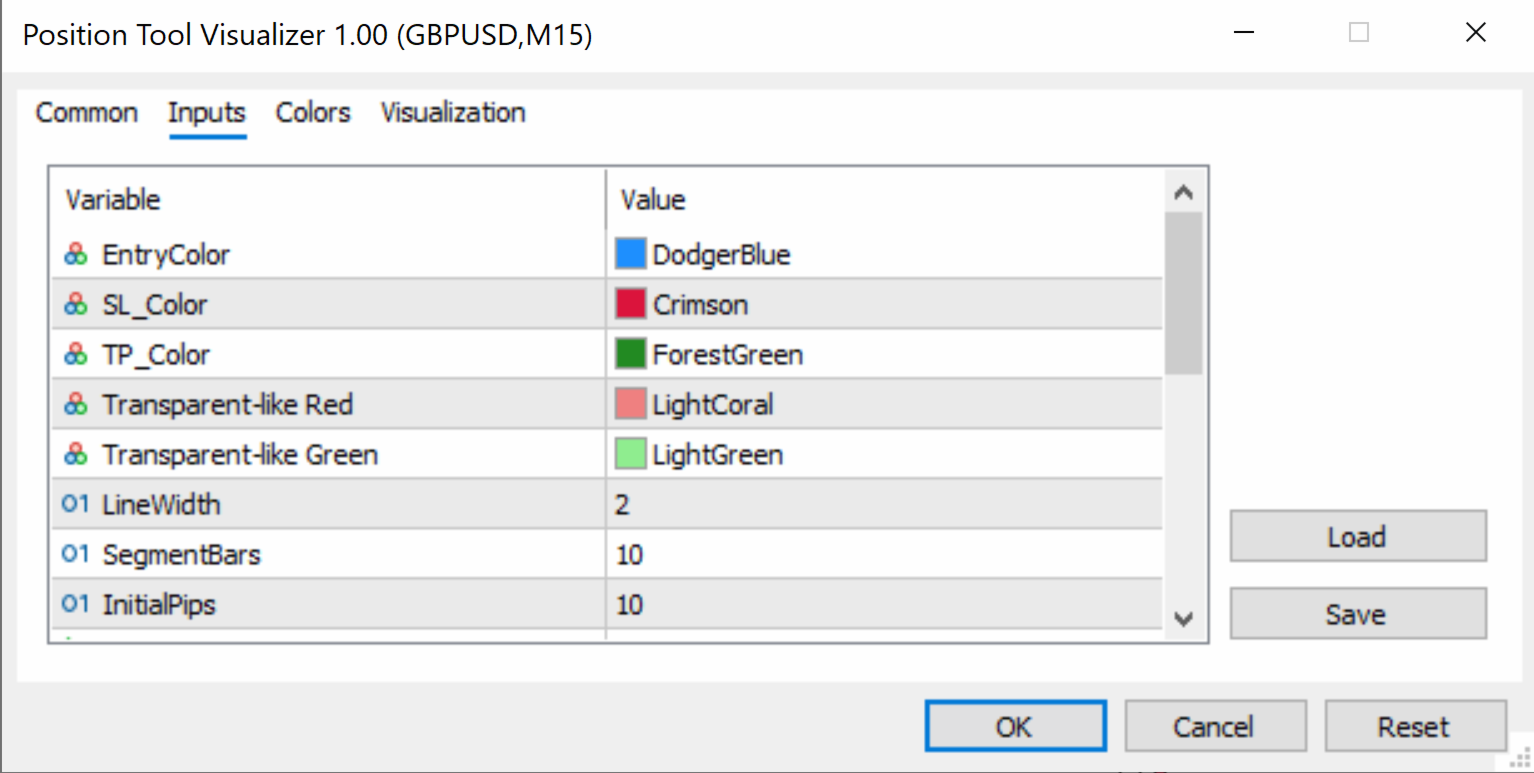
Parameters Input:
- EntryColor (default: clrDodgerBlue) — Color of the entry price line
- SL_Color (default: clrCrimson) — Color of the stop loss line
- TP_Color (default: clrForestGreen) — Color of the take profit line
- SL_RectColor (default: clrLightCoral) — Fill color of the risk zone rectangle (between Entry and SL)
- TP_RectColor (default: clrLightGreen) — Fill color of the reward zone rectangle (between Entry and TP)
- LineWidth (default: 2) — Thickness of the entry, SL, and TP lines (in pixels)
- SegmentBars (default: 10) — Width of each line segment (in bars)
- InitialPips (default: 10) — Initial distance from Entry to SL/TP when the tool is first created (in pips)
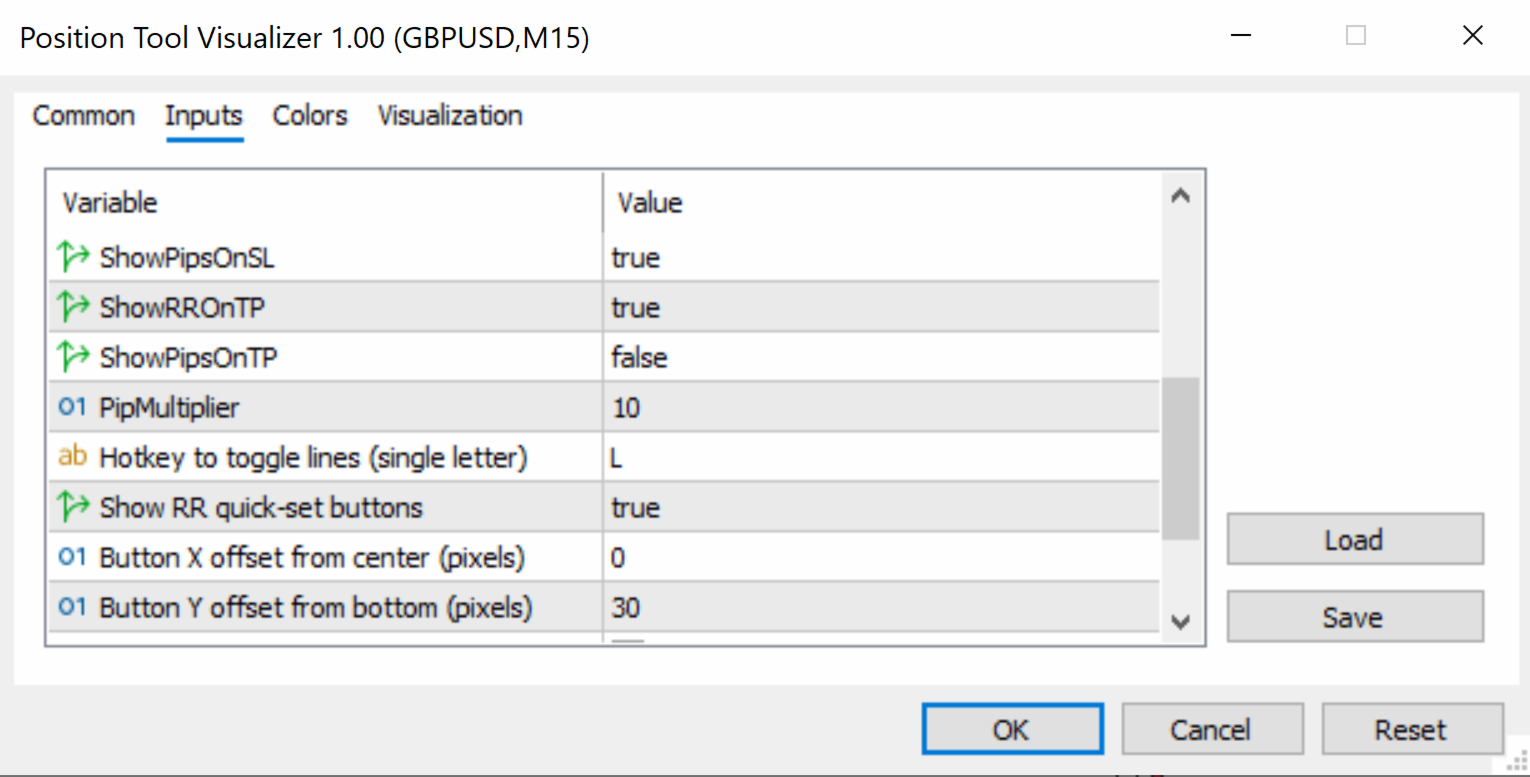
- ShowPipsOnSL (default: true) — If enabled, displays the pip distance on the SL label
- ShowRROnTP (default: true) — If enabled, displays the risk-reward ratio on the TP label
- ShowPipsOnTP (default: false) — If enabled, displays the pip distance on the TP label
- PipMultiplier (default: 10) — Multiplier for pip calculation (use 10 for standard 5-digit brokers, 1 for 4-digit brokers)
- HotKey (default: "L") — Keyboard key to toggle the tool on/off (single letter)
- ShowRRButtons (default: true) — If enabled, shows the 2RR, 3RR, 4RR, 5RR quick-set buttons
- ButtonXOffset (default: 0) — Horizontal offset for button panel from screen center (in pixels)
- ButtonYOffset (default: 30) — Vertical offset for button panel from the bottom of the chart (in pixels)
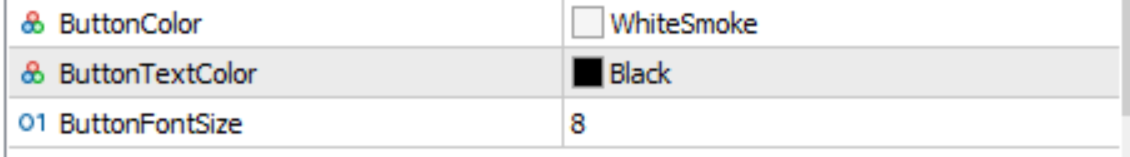
- ButtonColor (default: clrWhiteSmoke) — Background color of the RR buttons
- ButtonTextColor (default: clrBlack) — Text color of the RR buttons
- ButtonFontSize (default: 8) — Font size of the RR button labels