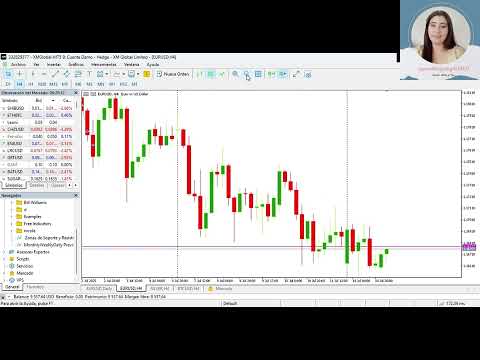
MonthlyWeeklyDaily Previous High and Lows
- Indicateurs
- Version: 1.0
- Activations: 7

Unlock instant clarity in your charts!
This indicator automatically draws the key levels where price has reacted or broken recently, giving you objective support and resistance zones without manual lines. Just attach it to your chart and watch the previous highs and lows appear for each timeframe.
What does each line mean?
-
Previous Month High
‣ Highest price recorded in the previous monthly period. -
Previous Month Low
‣ Lowest price recorded in the previous monthly period. -
Previous Week High
‣ Highest price recorded in the previous weekly period. -
Previous Week Low
‣ Lowest price recorded in the previous weekly period. -
Previous Day High
‣ Highest price recorded in the immediately preceding trading day. -
Previous Day Low
‣ Lowest price recorded in the immediately preceding trading day.
Why you’ll love it:
-
Spot bounces and breakouts as soon as you open your chart.
-
Place Take Profit and Stop Loss at historically proven levels.
-
Essential for SMC and ICT strategies, optimizing entries and exits with advanced market structure.
-
Works with any method: scalping, swing, Wyckoff, Price Action…
-
Super easy setup: toggle levels on/off and customize colors & line widths.