MN1 W1 D1 Closing Price Indicator
- Indicateurs
-
Andras Salamon
 „Everything should be made as simple as it can be, but not simpler.”
 - Version: 1.1
- Mise à jour: 9 février 2024
- Activations: 5
MN1-W1-D1 Close Price Indicator to Index Trading for MT5
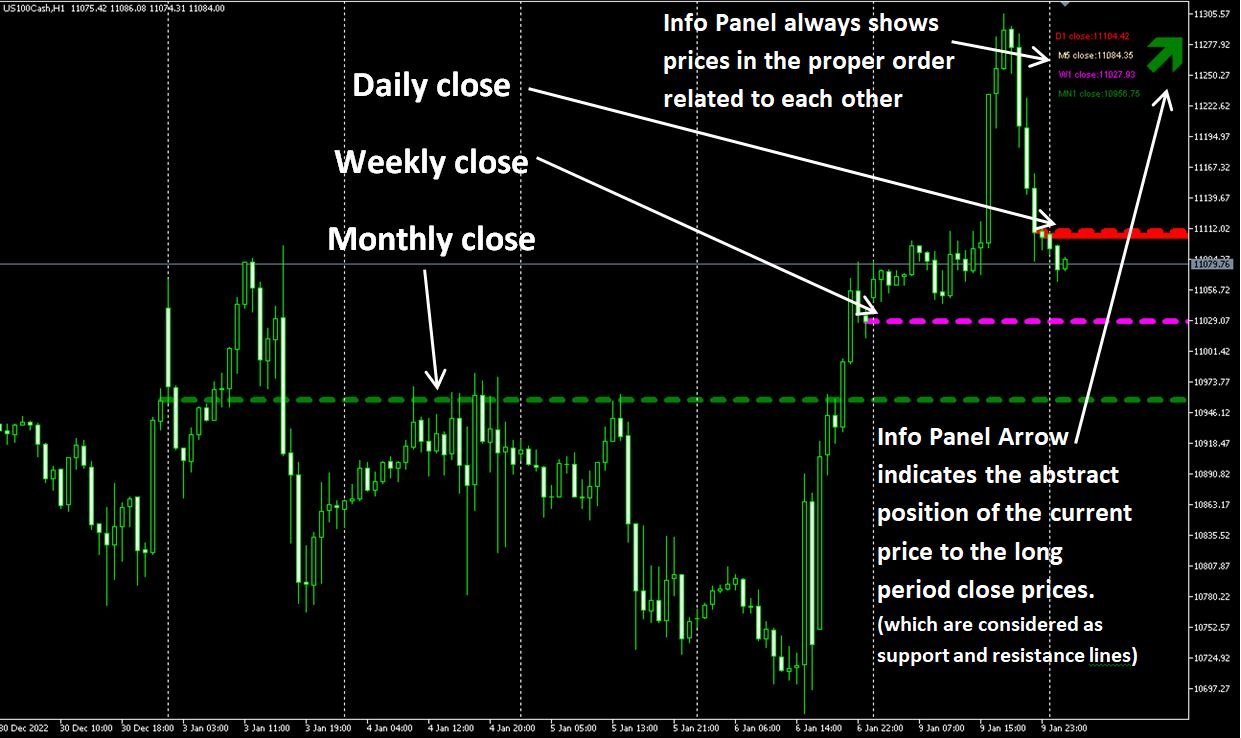
The indicator draws lines to the close prices of the last closed bars of monthly, weekly and daily timeframes. Observably, these prices are significant support and resistance prices at major indices, like Nasdaq, DAX.
The info panel always shows the prices relative to each other in the correct order. If the current price is the highest - i.e. higher than the last monthly, weekly and daily closing price - it is in the first row. The lowest price is always in the last, in the fourth line.
In the Info Panel, an Arrow indicates the abstract position of the current price related to the high timeframe prices, which the market often considers as support and resistance prices. If these prices or lines are broken, the opportunity for further price movement opens up. Especially when current price breaks all MN1, W1 and D1 prices.
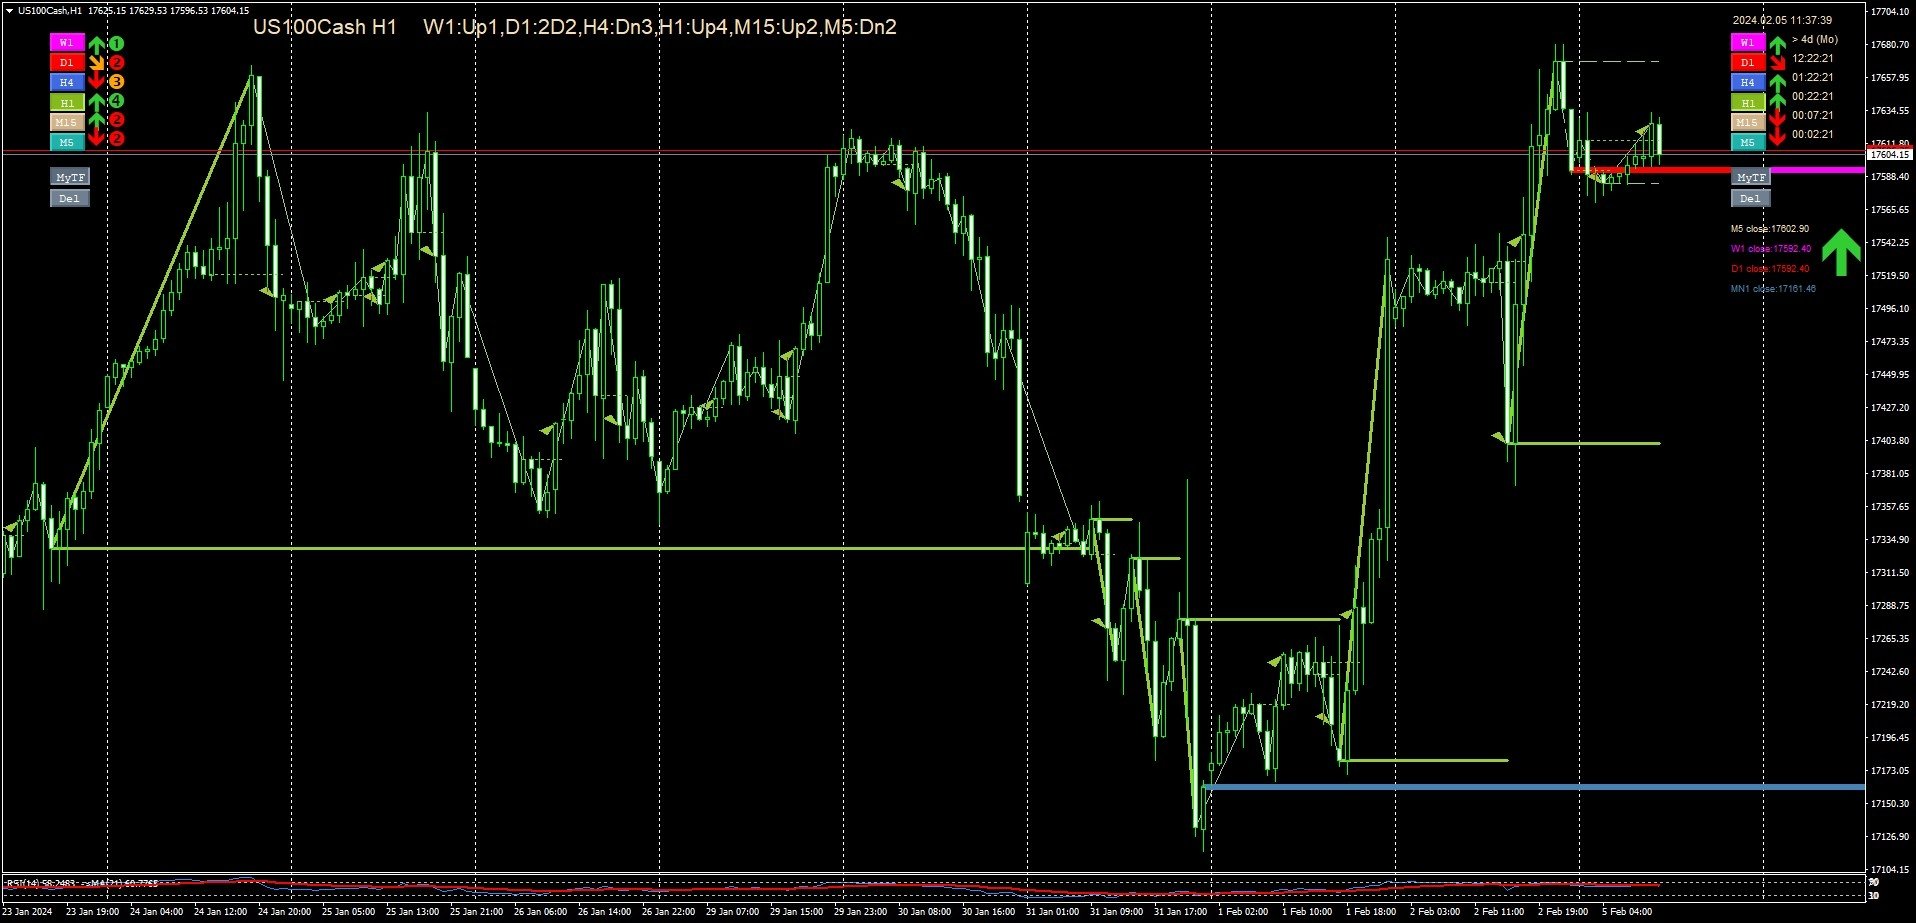
- The arrow is Lime and Up if the current price is the highest.
- The arrow is Green and in Right up if the current price is lower than the D1 line but higher than the W1 and MN1 line. It is worth watching the price movement, because if the market price breaks the daily price, an intense upward movement is probable.
- The arrow is Orange and Right down when the current price is higher than the D1 line but lower than the W1 and MN1 line. It is worth watching the price movement because if the market price breaks down the daily price, an intense downward movement is likely.
- The arrow is Red and Down when the current price is the lowest.
Please watch video to see how market usually behaves at these prices.
[ MT4 version | All Products ]
By combining the Trend Harmony indicator, the Break Harmony indicator with the MN1-W1-D1 Close Price Indicator, traders can attain an even more precise and comprehensive understanding of the chart dynamics. The Trend Harmony indicator, with its ability to identify and emphasize prevailing trends across multiple timeframes, works synergistically with the Break Harmony indicator's capacity to pinpoint breakout and breakdown points and MN1-W1-D1 Close Price indicator which shows strong long term Support and Resistance levels. Together, these three indicators create a holistic view of the market, integrating trend analysis with breakout signals and support and resistance levels.
L'utilisateur n'a laissé aucun commentaire sur la note