Forex Time Ext
- Indicateurs
- Version: 2.4
- Mise à jour: 20 décembre 2023
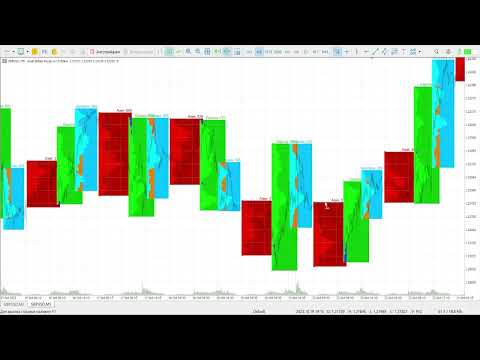
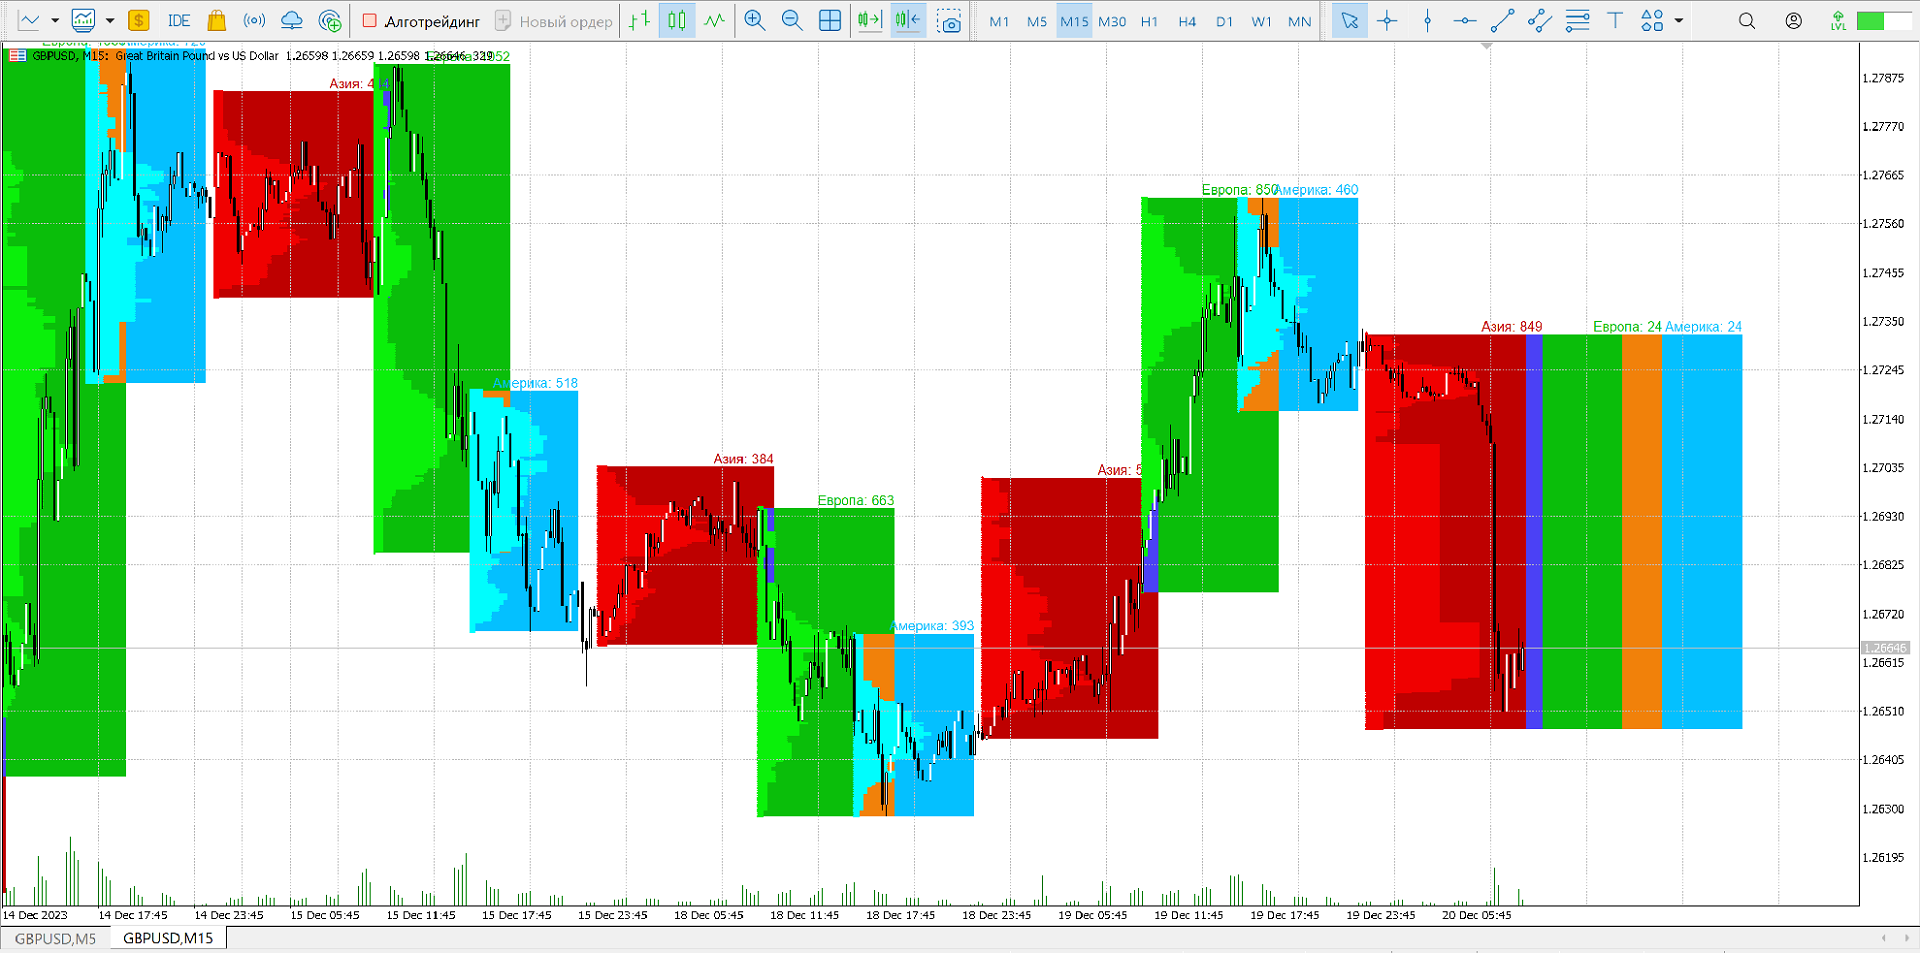
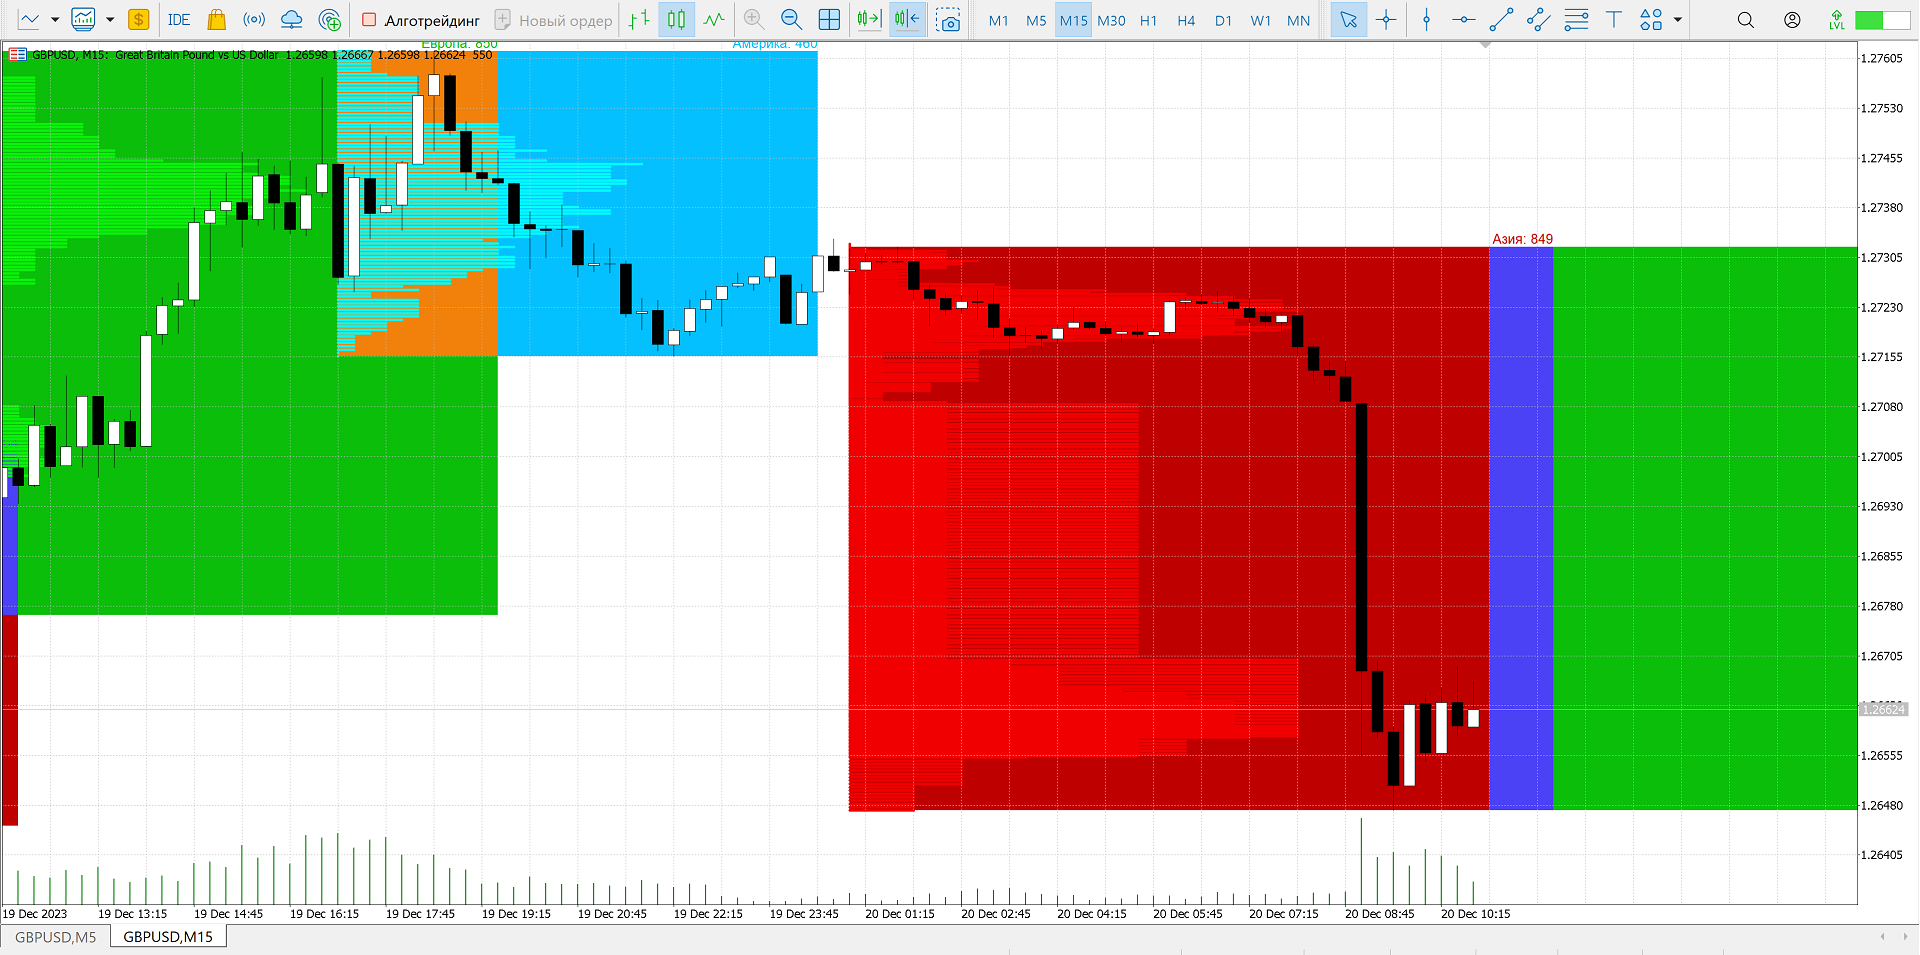
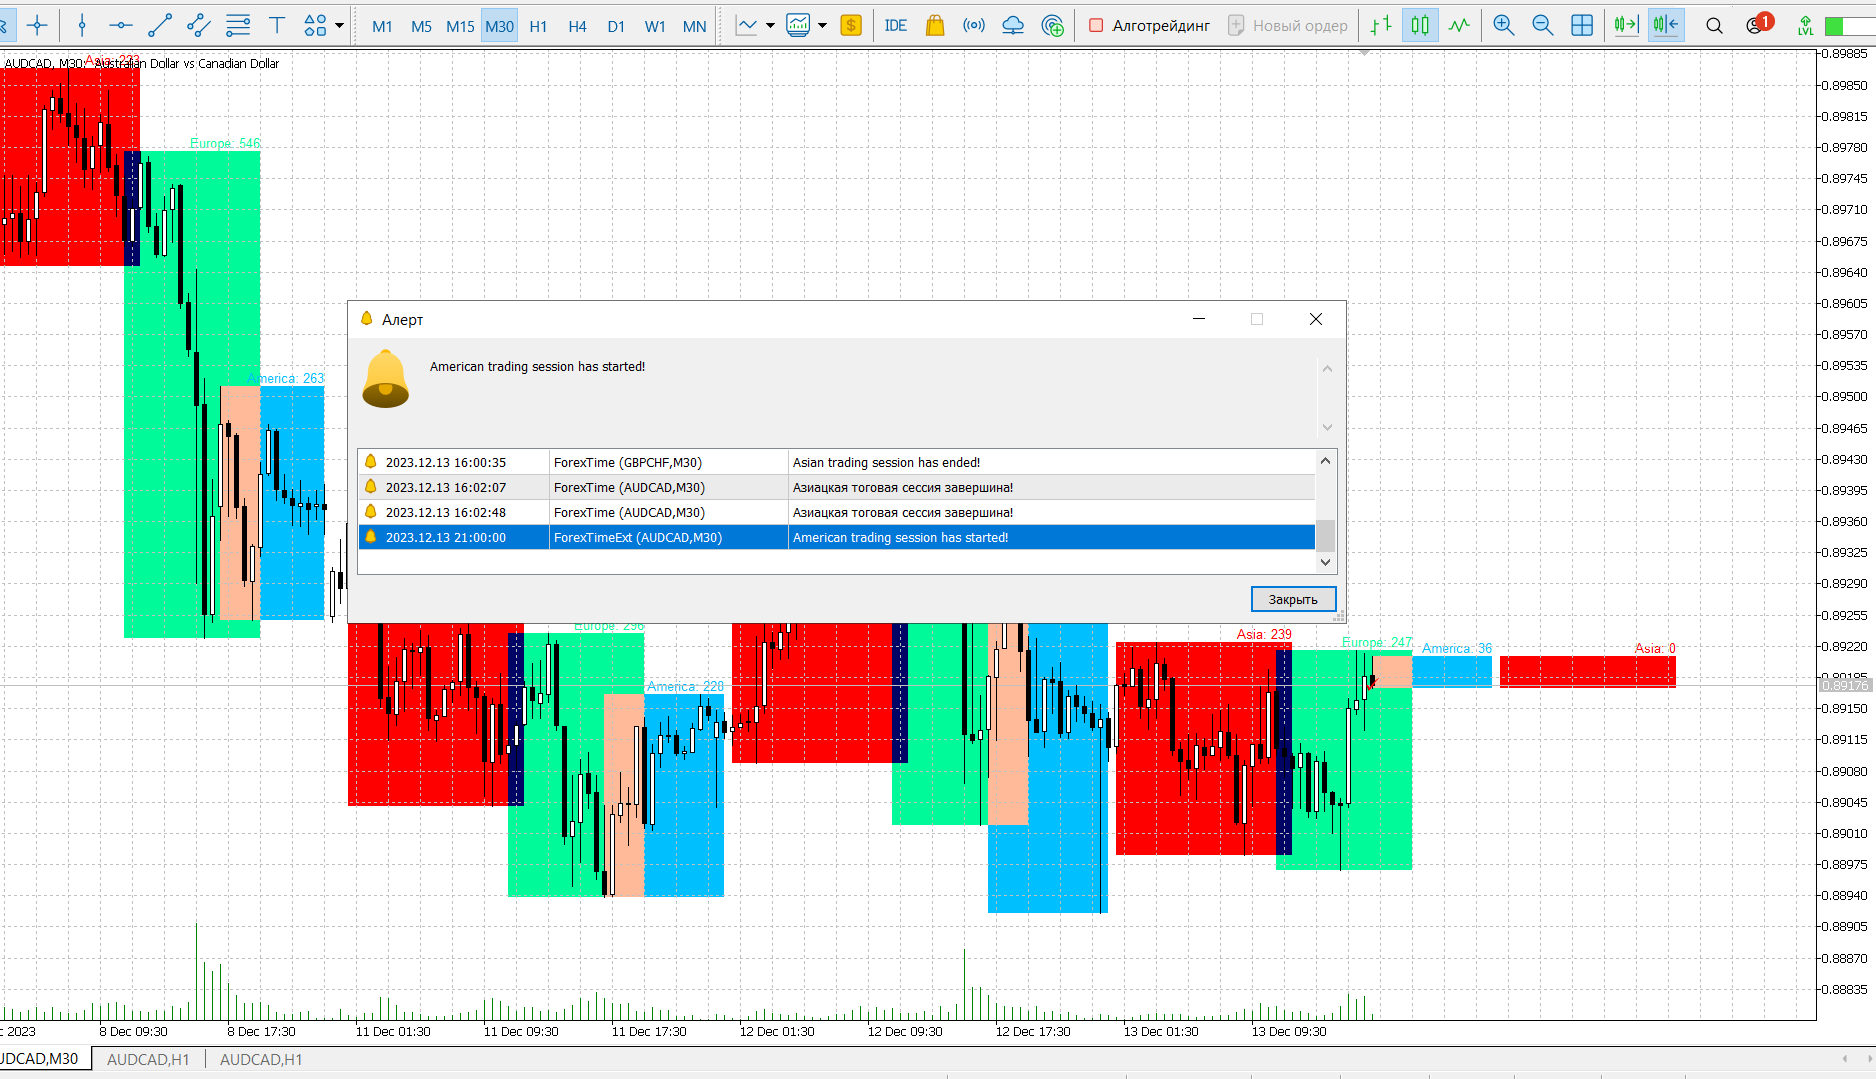
An extended version of the indicator for visualizing the time ranges of key trading sessions: Asian, European and American.
The main advantage of this indicator is the automatic construction of a price profile for a trading session.
The indicator has the functionality to set the start and end time of each trading session, as well as automatically determine the time zone of the trading server.
The indicators include the ability to work with minimal CPU usage and save RAM. In addition, the option to specify the number of historical days displayed is provided, providing the user with a flexible analysis of market dynamics.
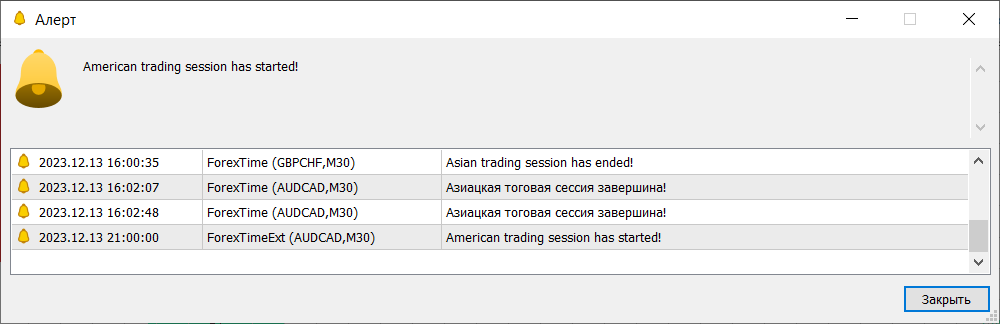
The indicator includes notification mechanisms at the beginning of trading sessions and at the end, as well as a notification time offset for user convenience.
There is bilingual (English, Russian) support for displayed text elements on the graph and notifications. The language is detected automatically, and you can also select it manually.
In order for the Notification to work on a mobile phone, you need to set up a terminal and a mobile device.
The indicator can be useful for applying various trading strategies, taking into account the exact time frame of trading sessions, which contributes to more effective development and implementation of strategies in the market.
Abbreviated free version https://www.mql5.com/ru/market/product/109873