SX Price Action Patterns MT4

SX Price Action Patterns is a comprehensive indicator which shows various price action patterns on the chart for those who are interested in price action trading. These patterns are as follows:

A Pin Bar is a candlestick price bar, which has a long wick on one side and a small body. It is a powerful signal of price reversal in a currency trading strategy.

An Inside Bar is characterized by a bar or candle that is entirely ‘inside’ the range of the preceding one and represents the consolidation of price action.

An Outside Bar completely ‘overshadows’ or ‘engulfs’ the previous bar. This pattern signals a potential shift in the market sentiment.

A Shaved Bar is a trend bar that is all body and has no tails or has a shaved top (no upper tail) or a shaved bottom (no lower tail). When a Shaved Bar appears in a strong trend, it demonstrates that the buying or the selling pressure was constant throughout with no let-up and it can be taken as a strong signal that the trend will continue.

A Fakey pattern appears when the price breaks one away from an inside bar but then returns to the opposite direction, triggering the price movement in that direction. Fakey is very important and potent price action trading strategy because it  can help us identify stop-hunting and provide us with a very good clue as to what price might do next.

A Three Bar Reversal pattern is used to identify trend reversal signals. The pattern involves 3 consecutive candlesticks, whose movement indicates whether a reversal in the trend is bound to happen or not.

A Pin Bar + Inside Bar Combo pattern consists of a Pin Bar that consumes an Inside Bar. It is an ideal setup to trade from pullbacks to key levels or as breakout plays in trending markets.

An Inside-Pin Bar Combo pattern is simply a Pin Bar that’s also an Inside Bar. This setup seems to work best in trending markets and on the daily chart time frames.

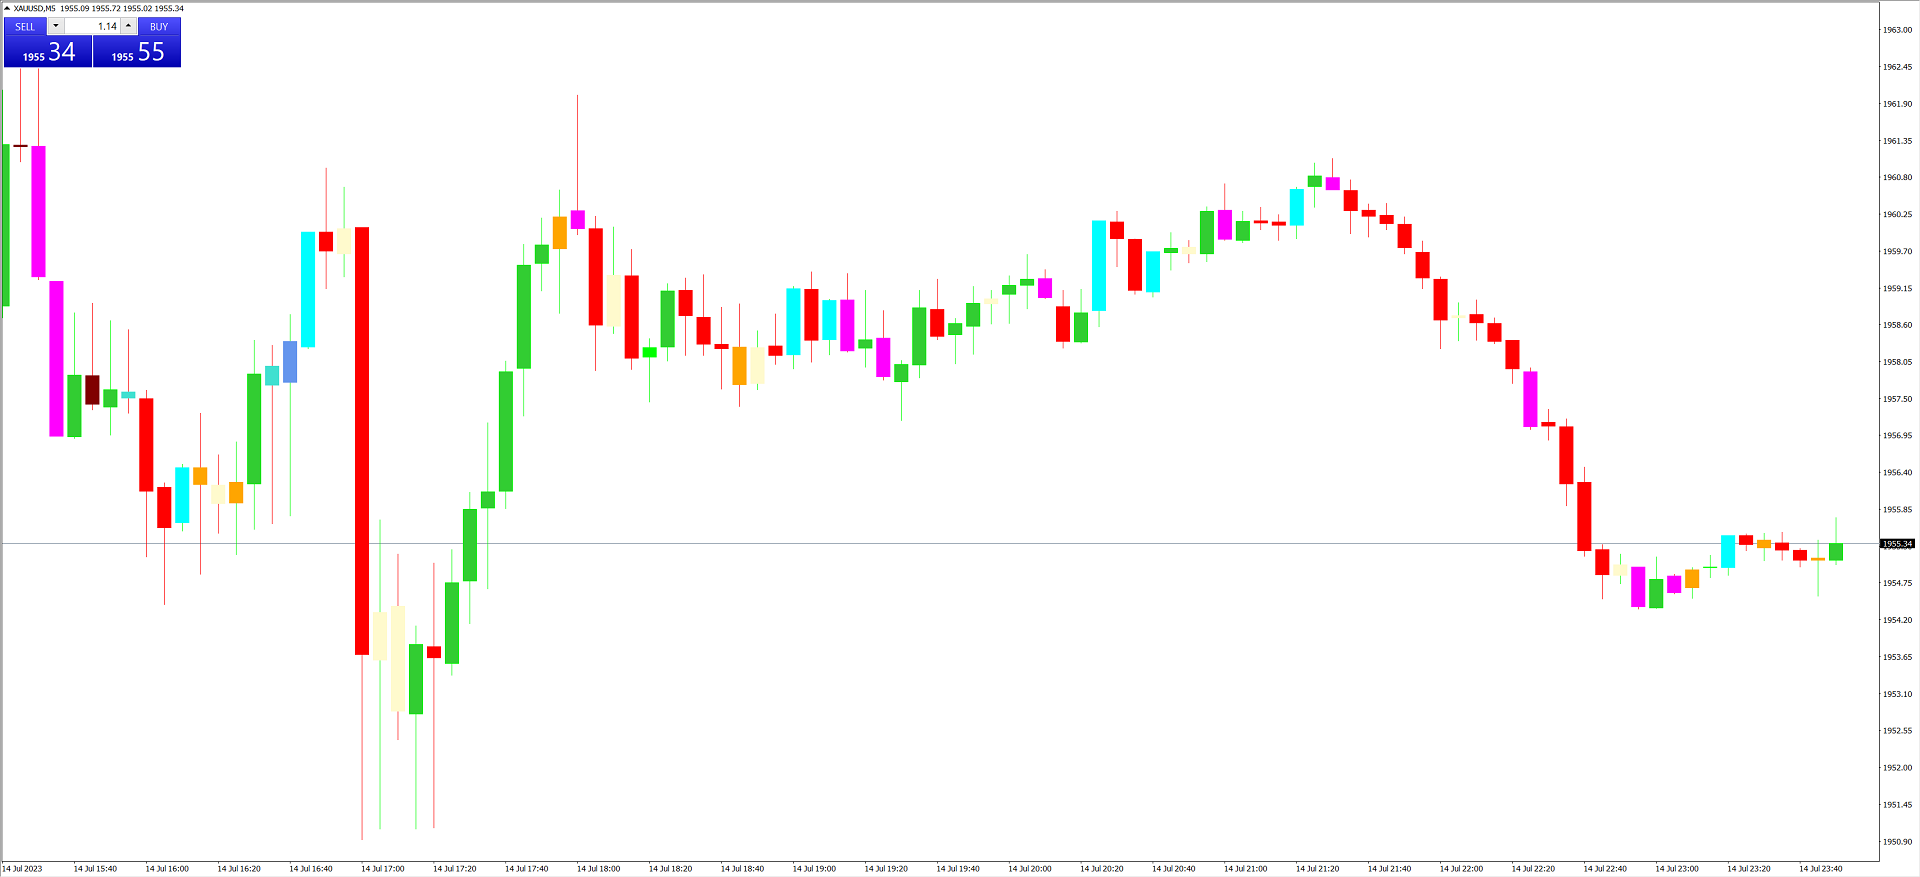
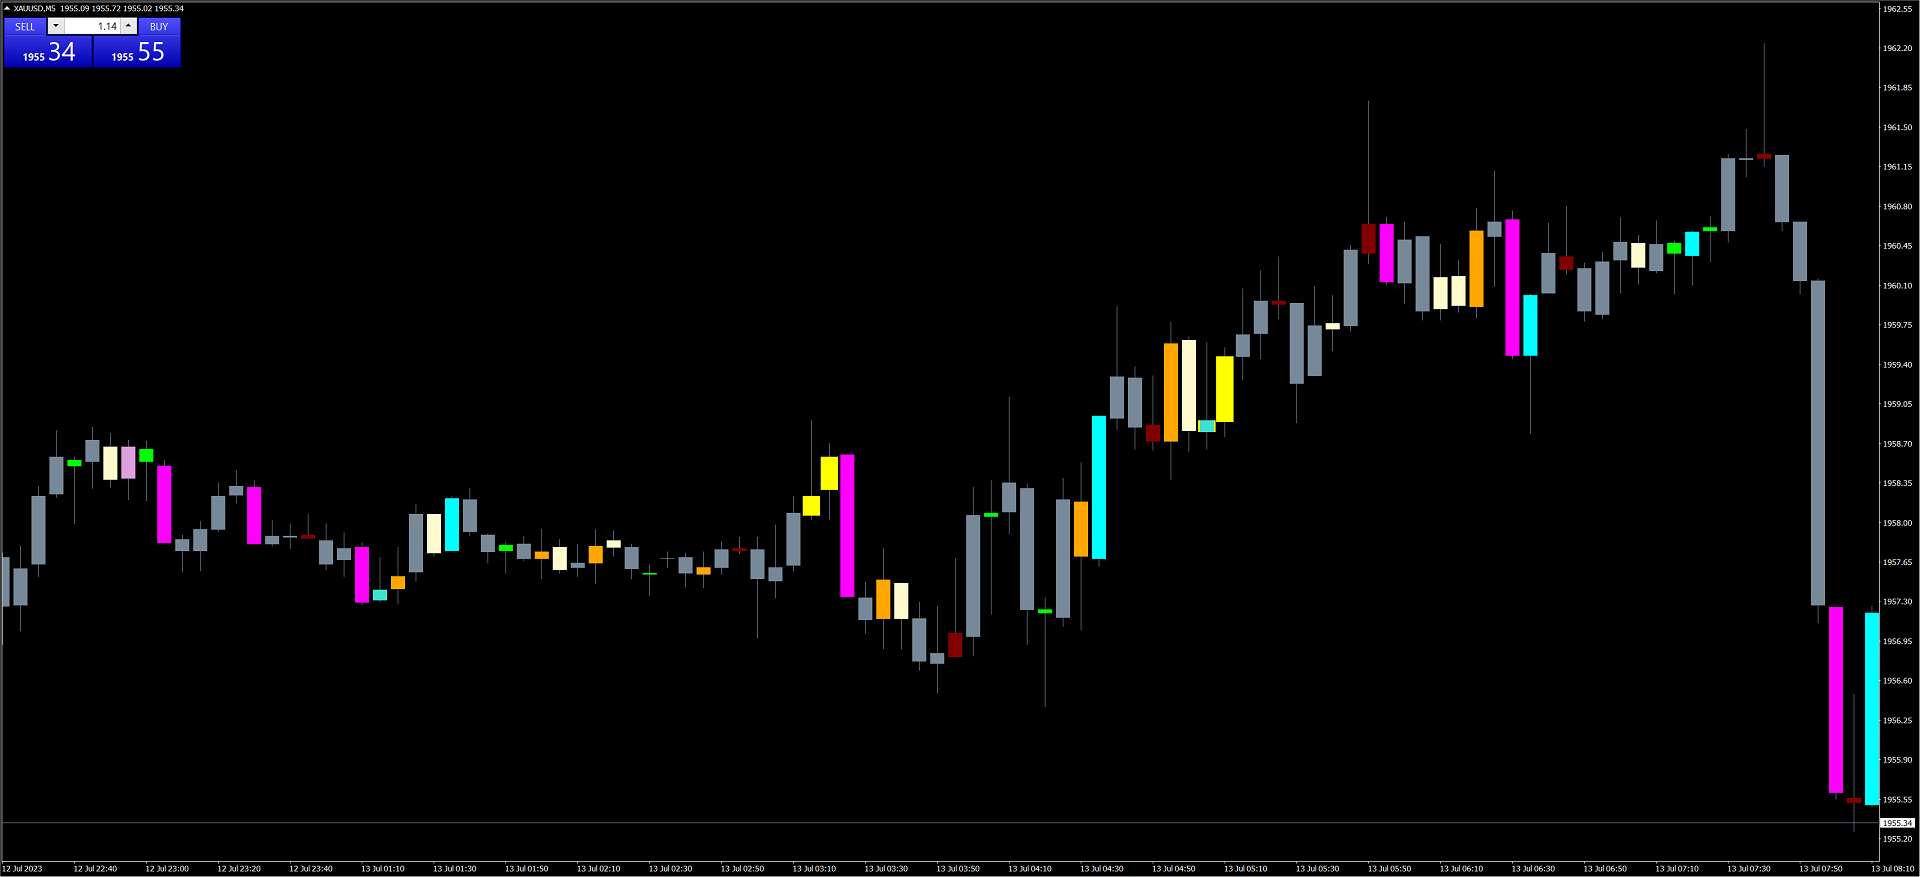
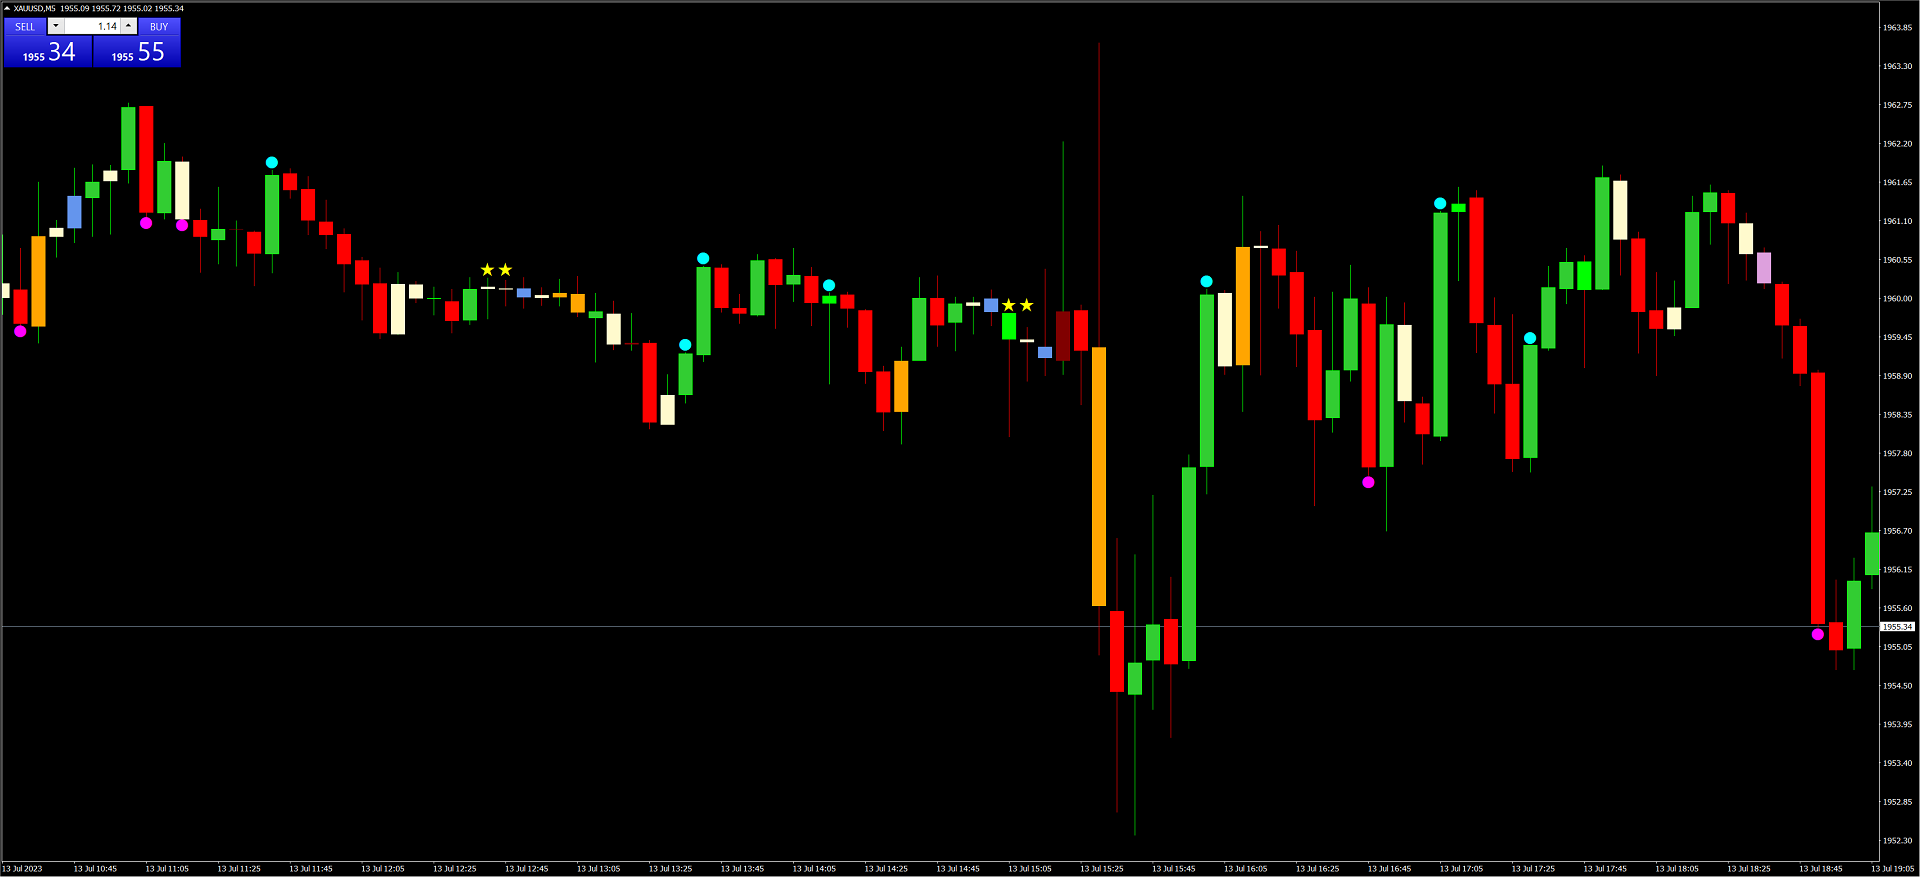
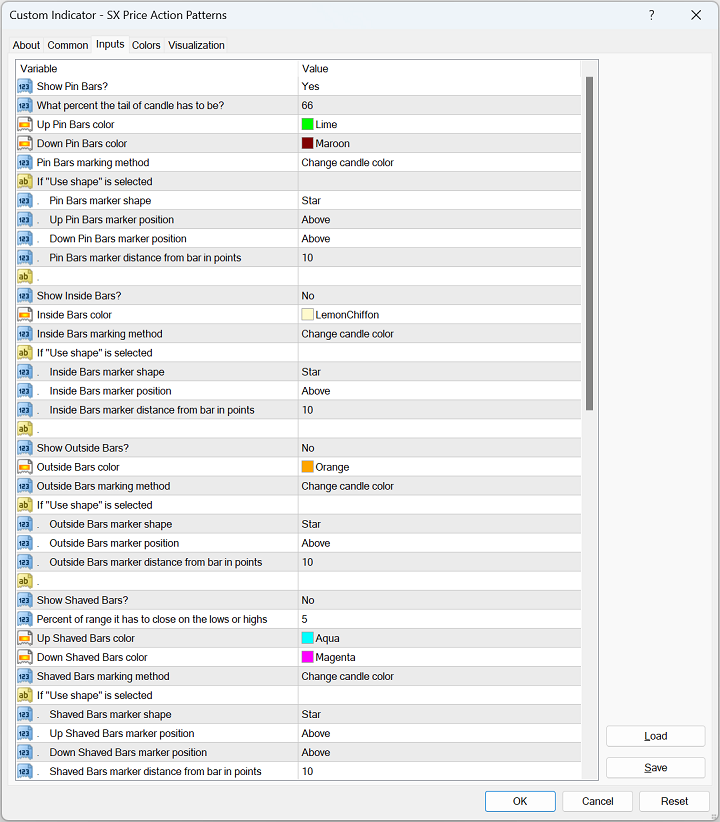
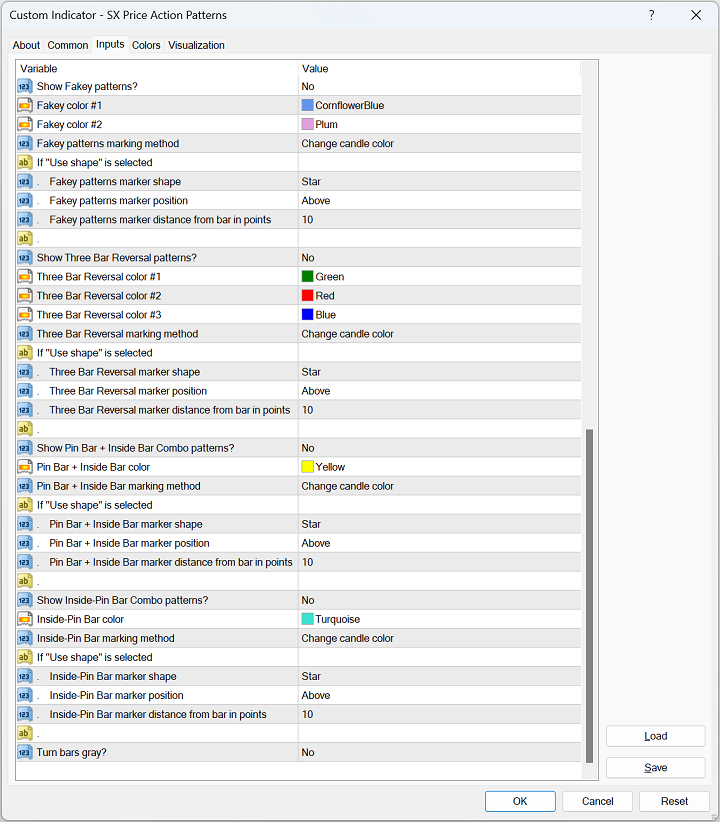
There are various settings for each of these patterns and you can specify the pattern you want with a shape or by changing the color of the candlestick on the chart.

There is also a unique option to gray out the chart temporarily so that you can clearly see the desired pattern.

#Tags: Pin Bar, PinBar, Pin-Bar, Inside Bar, InsideBar, Inside-Bar, Outside Bar, OutsideBar, Outside-Bar, Shaved Bar, ShavedBar, Shaved-Bar, Fakey, Three Bar Reversal, 3 Bar Reversal, Pin Bar + Inside Bar Combo, Inside-Pin Bar Combo, Pattern, Price Action, PriceAction

DISCLAIMER: Please notice that we do not provide any financial advice. We only provide tools for anyone interested in improving their trading.

Produits recommandés
Market Structure Zig Zag
Lesedi Oliver Seilane
4.66 (29)
Free Market structure zig zag to assist in price action trading the screenshots describe how to use and how to spot patterns new version comes with alerts, email alert and  push notification alert can be used on all pairs  can be used on all timeframes  you can add additional confirmation indicators the indicator shows you your higher high and low highs as well as your lower lows and lower highs  the indication makes price action analysis easier to spot.
FREE
GTAS FibTdi
Riviera Systems
GTAS FidTdi is a trend indicator using combination of volatility and potential retracement levels. This indicator was created by Bernard Prats Desclaux, proprietary trader and ex-hedge fund manager, founder of E-Winvest. Description The indicator is represented as a red or green envelope above or under prices. How to use Trend detecting When the envelope is green, the trend is bullish. When it is red, the trend is bearish. Trading Once a trade is opened, GTAS FibTdi shows retracement zones wh
FREE
Delta Fusion Pro
Francesco Secchi
5 (2)
Delta Fusion Pro – Analyse Avancée du Flux d’Ordres pour le Trading Intraday Delta Fusion Pro est un indicateur professionnel pour MetaTrader 4 qui révèle le flux des ordres agressifs, en affichant l’intensité et la direction de la pression institutionnelle en temps réel. Contrairement aux indicateurs volumétriques traditionnels, il analyse la delta entre les volumes Ask et Bid afin d’anticiper les retournements, confirmer les tendances et identifier les zones d’intérêt professionnel. Caractér
LordAutoFibonnaci
Igor Pereira Calil
5 (2)
Lord Auto Fibonnaci is a free indicator for Meta Trader, in order to show the most famous chart in the financial market known as "Fibonnaci". As we can see in the images below, the fibonnaci table will automatically analyze the graph for you, with trend factors through percentage, almost infallible use, you can always work when the percentage is low or high, start shopping and sales on time, great for analyzing entries! In the images below we can see an example in gold in H4, where we are at
FREE
Be notified of every color change of Heiken Ashi (HA) candles. The indicator will trigger past and new signals every time that HA candles change their colors. Note : this tool is based on the code of Heiken Ashi indicator developed by MetaQuotes Software Corp. Features The signals are triggered at closing of last bar/opening of a new bar; Any kind of alerts can be enabled: Dialog Box, Email message, SMS notifications for smartphones and tablets, and Sound alerts; By default, up arrows are plott
The indicator looks for buying and selling zones, where a deal can be opened with a minimal stop loss and a better Risk Reward Ratio. The indicator is based on qualitative search of the Double top/Double bottom pattern. This version works only on USDCAD! The full version of the indicator can be purchased here - https://www.mql5.com/en/market/product/29820 Indicator operation principle Looks for local tops/bottoms which can potentially become a Reversal zone It waits for an impulse movement that
FREE
The indicator allows you to trade binary options. The recommended time frame is М1 and the expiration time is 1 minutes. The indicator suitable for auto and manual trading. A possible signal is specified as a arrows above/under a candle. You should wait until the candle closes! Arrows are not re-painted Trade sessions: London and New York section Currency pairs: AUD/CAD Working time frame: M1 Expiration time: 1 minute The indicator also shows good results when using the martingale strategy - "Ma
FREE
AQ Pattern Explorer
HIT HYPERTECH INNOVATIONS LTD
3.67 (3)
Pattern Explorer is a reliable tool for applying all the power of the most popular Japanese Candlestick Patterns . It uses Machine Learning algorithms to confirm all the patterns. What is the most impressive thing about it? Select Take Profit and Stop Loss and click on “Backtest your strategy” button to backtest your strategy in real time and to see according to your selection: Total signals Testable signals (signals that are reliable to be tested) Profitable signals (%) Loss signals (%) Total p
FREE
DayTradingArrow v1
Nedyalka Zhelyazkova
5 (3)
Step into Confident Trading with DayTradingArrow v1 In trading, confidence comes from clarity, structure, and reliable signals . DayTradingArrow v1 is designed to give you exactly that – a tool that highlights opportunities, filters out noise, and supports smart, disciplined decisions. Every signal is confirmed and actionable , allowing you to trade with confidence rather than guesswork. Key Benefits Clear buy and sell signals for fast, confident decision-making Perfect for beginners and exper
Crypto_Forex Indicator HTF Ichimoku pour MT4. - L'indicateur Ichimoku est l'un des indicateurs de tendance les plus puissants. HTF signifie - Higher Time Frame. - Cet indicateur est excellent pour les traders de tendance ainsi que pour la combinaison avec les entrées Price Action. - L'indicateur HTF Ichimoku vous permet d'attacher Ichimoku d'une période plus élevée à votre graphique actuel. - Tendance à la hausse - ligne rouge au-dessus de la bleue (et les deux lignes sont au-dessus du nuage)
Tin
Maryna Shulzhenko
The Tin indicator is designed to visually display the current trend in the market. One of the key aspects of foreign exchange market analysis is to determine the trend, which is the sustainable direction of price movement. To do this, the Tin indicator uses algorithms that smooth out sharp fluctuations that do not have a significant impact on the overall trend. A trend can be either upward (bullish) or downward (bearish). Typically, a trend persists for a long time before abruptly changing dir
Line Magnit
Aleksey Trenin
The LineMagnit Indicator for MT4 is a highly precise tool that builds support and resistance levels which magnetically attract prices. This feature allows traders to easily determine the most probable entry and exit points in the market, as well as identify the market's directional forces, as levels are based on capital inflows into the instrument. Equipped with an intuitively understandable graphical interface, the LineMagnit Indicator enables users to quickly locate and analyze support and res
VR Cub
Vladimir Pastushak
VR Cub est un indicateur permettant d'obtenir des points d'entrée de haute qualité. L'indicateur a été développé pour faciliter les calculs mathématiques et simplifier la recherche de points d'entrée dans un poste. La stratégie de trading pour laquelle l'indicateur a été rédigé prouve son efficacité depuis de nombreuses années. La simplicité de la stratégie de trading est son grand avantage, qui permet même aux traders débutants de négocier avec succès avec elle. VR Cub calcule les points d'ouve
Современный индикатор паттернов PinBar по торговой стратегии RAIT. Работает по тренду и без него. Имеет настройки таймфрейма для отображения. Можно настроить количество баров для отображения индикатора на графике. Используется несколько паттернов PinBar. Индикатор предпочтительно использовать на часовом таймфрейме и выше,   но работает и ниже   . Паттерны:  PinBar, InsPinBar, PinInside. Отображаются одной стрелкой.
HMA Trend Professional MT4
Pavel Zamoshnikov
4.57 (7)
Improved version of the free HMA Trend indicator (for MetaTrader 4) with statistical analysis. HMA Trend is a trend indicator based on the Hull Moving Average (HMA) with two periods. HMA with a slow period identifies the trend, while HMA with a fast period determines the short-term movements and signals in the trend direction. The main differences from the free version: Ability to predict the probability of a trend reversal using analysis of history data. Plotting statistical charts for analyzi
TurnPoint Indicator – Market Reversal & Trend Signal Tool The TurnPoint Indicator is designed to help traders identify potential turning points and key levels in the market. By analyzing price action, it highlights areas where reversals or continuations are likely to occur, allowing traders to anticipate trend changes more effectively. This tool incorporates advanced logic to filter signals, reducing noise and false alerts. Users can choose between breakout and pullback modes, depending on thei
FREE
Trend Monitor
Pavel Zamoshnikov
4 (4)
The indicator generates early signals basing on ADX reading data combined with elements of price patterns. Works on all symbols and timeframes. The indicator does not redraw its signals. You see the same things on history and in real time. For better visual perception signals are displayed as arrows (in order not to overload the chart). Features Easy to use. Filter configuration only requires selection of sensitivity in the " Sensitivity of the indicator " input. Signals can be filtered using
The indicator allows you to trade binary options. The recommended time frame is М1 and the expiration time is 1 minute. The indicator suitable for auto and manual trading. A possible signal is specified as a arrows above/under a candle. You should wait until the candle closes! Arrows are not re-painted Trade sessions: TOKYO section (Half end) and LONDON section (First half) Currency pairs: EUR/USD Working time frame: M1 Expiration time: 1 minute. The indicator also shows good results when using
FREE
Momentum Breakout Envelope
Pieter Gerhardus Van Zyl
Momentum Breakout Envelope is a momentum-analysis indicator designed to highlight potential breakout phases and shifts in market strength. It runs in a separate window and displays three main elements: an upper band , a lower band , and a momentum core line . Together they form a dynamic envelope that expands or contracts as market momentum changes. The bands act as a structured range that helps visualize momentum pressure, while the core line represents the underlying strength of the current mo
BE auto
Muhammad Ridzuan Mohd Radzali
5 (2)
Indicator automatically draw bullish and bearish engulfing without any rules. Bearish and Bullish engulf is well known area for supply and demand area marking. This indicator can be used in any strategy that required supply demand zone. Show Last Engulf : Enable this option to show unfresh engulfing  Candle to calculate : set 0 will load all history bar and can use up more memory Bearish Engulfing Colour : Pick any colour that suit Bearish Engulfing Colour  : Pick any colour that suit -Use this
FREE
MasterArrow
Pavel Krysanov
5 (1)
Correct market entries and exits are essential for any Forex trader. MasterArrow indicator addresses this issue. It has no redundant elements and draws only buy/sell arrows. The up arrow is a BUY signal, while the down arrow is a SELL one. The indicator is simple to configure. Change the Strength parameter to configure the signals frequency. The product is based on standard indicators (MA, RSI, ATR, etc.). But it also features the custom algorithm allowing to combine them into a single tool and
The   Trendlines Oscillator   helps traders identify trends and momentum based on the normalized distances between the current price and the most recently detected bullish and bearish trend lines. The indicator features bullish and bearish momentum, a signal line with crossings, and multiple smoothing options. USAGE The   Trendlines Oscillator   works by systematically: Identifying pivot highs and lows. Connecting pivots to form bullish (support) and bearish (resistance) trendlines. Measuring
MACD Signals Dashboard
Mihails Babuskins
4 (4)
Download directly the indicator file here. (if you can't open on MT4) MACD Indicator is one of the most popular momentum indicators among users. Searching and detecting MACD signals by the eye may not be easy. Scan Full Charts Dashboard Indicator with simple user interface and search customization panel saves time and scans all charts for MACD signals search and notifies the user with high accuracy. After finding the signal, the user was aware of the result by alerts and notifications. This ind
FREE
Order Blocks Breaker
Suvashish Halder
5 (2)
Introducing Order Blocks Breaker , a brand-new way to identify and leverage order blocks in your trading strategy. After developing multiple order block tools with unique concepts, I’m proud to present this tool that takes things to the next level. Unlike previous tools, Order Blocks Breaker not only identifies order blocks but also highlights Breaker Order Blocks —key areas where the price is likely to retest after a breakout. MT5 -  https://www.mql5.com/en/market/product/124102/ This tool inco
The indicator displays signals on the chart of the classic RVI indicator with an alert. The indicator signals after confirmation of the strategy at the opening of a new bar. I recommend watching my advisor -   Night Zen EA In the settings, you can select the following strategies: The main line crosses the signal line The main line crosses the zero level In the settings, you can change the period of the classic RVI indicator. I also recommend to look at my other developments in the market: ht
FREE
Check My Product Contact me to discover all my services  Supply and demand zones are one of the most basic things a beginner forex trader learns. These zones are so important, price reacts off of them even after years since they first developed. And with the supply and demand zones indicator, a forex trader might not need to worry about drawing all these historical zones one after the other. The supply and demand zone indicator accurately draws the supply and demand zones of a currency pair o
Rainbow Price Visualizer v1.21 See where the market really breathes. Turns your MT4 chart into an ultra-precise heatmap that highlights price zones favored by big players. Why it matters 300 price levels at 0.2‑pip resolution — microscopic detail. 8 visual themes (Rainbow, Fire, Ocean…) for instant readibility. Smart opacity: low noise fades, real zones pop. Lightweight rendering with automatic cleanup. Fully customizable: saturation, opacity, resolution, history depth. Bands project into the f
Easy Trade indicator
Felipe Carvalho De Queiroz
Easy Trade Indicator – Your Path to Profitable Trades! Work any Time Frame! Maximize your profits with precise and assertive trades! ️ Trade with comfort – the indicator does the analysis and you only open the order in the direction in which the indicator shows you!  Exclusive panel with past trade counter and accuracy tracking! Simplify your analysis, boost your performance, and trade with confidence! Get it now and take your trading to the next level
Trend PA
Mikhail Nazarenko
5 (3)
The Trend PA indicator uses   Price Action   and its own filtering algorithm to determine the trend. This approach helps to accurately determine entry points and the current trend on any timeframe. The indicator uses its own algorithm for analyzing price changes and Price Action. Which gives you the advantage of recognizing, without delay, a new nascent trend with fewer false positives. Trend filtering conditions can be selected in the settings individually for your trading style. The indicator
Les acheteurs de ce produit ont également acheté
Gann Made Easy
Oleg Rodin
4.83 (162)
Gann Made Easy est un système de trading Forex professionnel et facile à utiliser qui est basé sur les meilleurs principes de trading en utilisant la théorie de mr. WD Gann. L'indicateur fournit des signaux d'ACHAT et de VENTE précis, y compris les niveaux Stop Loss et Take Profit. Vous pouvez échanger même en déplacement en utilisant les notifications PUSH. VEUILLEZ ME CONTACTER APRÈS L'ACHAT POUR RECEVOIR GRATUITEMENT DES INSTRUCTIONS DE TRADING ET D'EXCELLENTS INDICATEURS SUPPLÉMENTAIRES! Vou
The Propfolio Master Suite is the ultimate all-in-one analytical workstation for professional traders. Combining the power of the Beat The Market Maker (BTMM) methodology, Smart Money Concepts (SND/Liquidity), and Advanced Volume Profile, this suite replaces multiple different indicators with one optimized engine. Monitor up to 14 pairs simultaneously from a single chart, instantly identify market cycles, and seamlessly map institutional footprints with the click of a button. The Command Center
M1 Sniper
Oleg Rodin
5 (23)
M1 SNIPER est un système d'indicateurs de trading facile à utiliser. Il s'agit d'un indicateur à flèche conçu pour l'unité de temps M1. Cet indicateur peut être utilisé seul pour le scalping sur l'unité de temps M1 ou intégré à votre système de trading existant. Bien que conçu spécifiquement pour le trading sur l'unité de temps M1, ce système peut également être utilisé avec d'autres unités de temps. Initialement, j'avais conçu cette méthode pour le trading du XAUUSD et du BTCUSD. Cependant, je
PZ Harmonacci Patterns
PZ TRADING SLU
3.17 (6)
Trade smarter, not harder: Empower your trading with Harmonacci Patterns This is arguably the most complete harmonic price formation auto-recognition indicator you can find for the MetaTrader Platform. It detects 19 different patterns, takes fibonacci projections as seriously as you do, displays the Potential Reversal Zone (PRZ) and finds suitable stop-loss and take-profit levels. [ Installation Guide | Update Guide | Troubleshooting | FAQ | All Products  ] It detects 19 different harmonic pric
Auto Optimized Parabolic RSI : Moteur de Momentum 3D Avancé La plupart des indicateurs pour les particuliers échouent car ils s'appuient sur des paramètres statiques qui se brisent dès que la volatilité du marché change. L'Auto Optimized Parabolic RSI résout le problème de l'« obsolescence des indicateurs » en recalculant continuellement son propre avantage mathématique, apportant une adaptation quantitative de niveau institutionnel directement sur votre terminal MT5. L'Avantage Principal : Opti
Scalper Inside PRO
Alexey Minkov
4.74 (69)
Scalper Inside PRO – Since 2020. An exclusive indicator that utilizes an innovative algorithm to swiftly and accurately determine the market trend. The indicator automatically calculates opening, closing, and profit levels, providing detailed trading statistics. With these features, you can choose the most appropriate trading instrument for the current market conditions. Additionally, you can easily integrate your own arrow indicators into Scalper Inside Pro to quickly evaluate their statistics
Le système PRO Renko est un système de trading très précis spécialement conçu pour le trading de graphiques RENKO. Il s'agit d'un système universel qui peut être appliqué à divers instruments de négociation. Le système neutralise efficacement ce qu'on appelle le bruit du marché en vous donnant accès à des signaux d'inversion précis. L'indicateur est très facile à utiliser et n'a qu'un seul paramètre responsable de la génération du signal. Vous pouvez facilement adapter l'outil à n'importe que
Quants HL Break
Ferhat Mutlu
5 (2)
Calcul avancé effectué par l'action pure des prix pour trouver les cassures LH et HL. Cela vous donnera d'excellents points d'inversion sur le marché.Les signaux LH et HL peuvent également être utilisés pour les évasions de traingle. Une fois que la cassure se produit, cela indique un fort renversement.Beau filtre pour les moyennes mobiles.Je suggère fortement de l'utiliser avec des indicateurs de tendance. Peut être utilisé comme une confirmation supplémentaire pour le support et la résistanc
Quantum Breakout Indicator PRO
Bogdan Ion Puscasu
4.96 (26)
Présentation       Quantum Breakout PRO   , l'indicateur révolutionnaire MQL5 qui transforme la façon dont vous négociez les zones d'évasion ! Développé par une équipe de traders expérimentés avec une expérience de trading de plus de 13 ans,   Quantum Breakout PRO   est conçu pour propulser votre parcours de trading vers de nouveaux sommets grâce à sa stratégie de zone de discussion innovante et dynamique. Quantum Breakout Indicator vous donnera des flèches de signalisation sur les zones d'év
RFI levels PRO
Roman Podpora
5 (1)
L'indicateur montre avec précision les points de retournement et les zones de retour des prix où le       Acteurs majeurs   . Vous repérez les nouvelles tendances et prenez des décisions avec une précision maximale, en gardant le contrôle de chaque transaction. VERSION MT5     -     Révèle son potentiel maximal lorsqu'il est combiné à l'indicateur   TREND LINES PRO Ce que l'indicateur montre : Structures et niveaux d'inversion avec activation au début d'une nouvelle tendance. Affichage des nive
Apollo SR Master est un indicateur de support/résistance doté de fonctionnalités spéciales qui simplifient et fiabilisent le trading basé sur les zones de support/résistance. Cet indicateur calcule ces zones en temps réel, sans aucun décalage, en détectant les sommets et les creux locaux des prix. Pour confirmer la nouvelle zone de support/résistance, il affiche un signal spécifique indiquant que cette zone peut être prise en compte et utilisée comme un véritable signal d'achat ou de vente. Dans
Si vous achetez cet indicateur, vous recevrez mon Gestionnaire de Trading Professionnel   + EA  GRATUITEMENT. Tout d'abord, il convient de souligner que ce système de trading est un indicateur non repeint, non redessiné et non retardé, ce qui le rend idéal pour le trading manuel et automatisé. Cours en ligne, manuel et téléchargement de préréglages. Le "Système de Trading Smart Trend MT5" est une solution de trading complète conçue pour les traders débutants et expérimentés. Il combine plus de
ACTUELLEMENT 40% DE RÉDUCTION La meilleure solution pour tout débutant ou trader expert ! Cet indicateur est un outil de trading unique, de haute qualité et abordable car nous avons incorporé un certain nombre de caractéristiques exclusives et une nouvelle formule. Avec seulement UN graphique, vous pouvez lire la force de la devise pour 28 paires Forex ! Imaginez comment votre trading va s'améliorer parce que vous êtes capable de repérer le point de déclenchement exact d'une nouvelle tendance
Signal GoldRush Trend Arrow L'indicateur GoldRush Trend Arrow Signal fournit une analyse précise et en temps réel des tendances, spécialement conçue pour les scalpers à haute vitesse et à court terme sur la paire XAU/USD. Conçu spécialement pour les intervalles de temps d'une minute, cet outil affiche des flèches directionnelles indiquant clairement les points d'entrée, ce qui permet aux scalpers de naviguer en toute confiance dans des conditions de marché volatiles. L'indicateur se compose
Day Trader Master est un système de trading complet pour les day traders. Le système se compose de deux indicateurs. Un indicateur est un signal fléché pour acheter et vendre. C'est l'indicateur de flèche que vous obtenez. Je vous fournirai le deuxième indicateur gratuitement. Le deuxième indicateur est un indicateur de tendance spécialement conçu pour être utilisé conjointement avec ces flèches. LES INDICATEURS NE RÉPÉTENT PAS ET NE TARDENT PAS! L'utilisation de ce système est très simple. Il v
Market Structure Patterns MT4
Samuel Manoel De Souza
5 (18)
Market Structure Patterns   est un indicateur basé sur les   Smart Money Concepts   qui affiche les   éléments SMC/ICT   pouvant améliorer vos décisions de trading. Profitez des   alertes ,   notifications push   et   emails   pour être informé lorsqu’un élément se forme sur le graphique, que le prix franchit un niveau et/ou entre dans une zone. Les développeurs peuvent accéder aux valeurs des éléments de l’indicateur via les   variables globales , permettant l’automatisation des décisions de tr
Advanced Supply Demand
Bernhard Schweigert
4.91 (300)
Offre spéciale : 40 % de réduction La solution idéale pour les traders débutants comme experts ! Cet indicateur est un outil de trading unique, performant et abordable grâce à l’intégration de nombreuses fonctionnalités exclusives et d’une nouvelle formule. Cette mise à jour vous permet d’afficher des zones sur deux unités de temps. Vous pourrez ainsi visualiser non seulement une unité de temps supérieure, mais aussi l’unité de temps du graphique, ainsi que l’unité de temps supérieure : des z
CRT Candle Range Theory HTF MT4.   Ultimate CRT Indicator: Advanced ICT Concepts and Malaysian SnR Trading System Discounted   Price   $50  !!     Secure your lifetime access   now   before it switches to   subscription-only ! Master the Market Maker's Footprints with the Most Advanced Candle Range Theory Indicator Unlock the true power of   Smart Money Concepts (SMC)   and trade precisely like the institutions with the   Ultimate CRT Indicator . Built exclusively for serious traders, this indic
Identify key turning points with reliable fractal analysis This indicator examines the price structure of fractals of different periods to determine possible reversal points in the market, providing timing to positional traders that already have a fundamental or technical valuation model. Unlike its younger brother, Reversal Fractals , this indicator won't miss reversals because of the period selected, and will find reversal fractals on a zig-zag fashion, ignoring those reversals which do not
L'indicateur « Dynamic Scalper System » est conçu pour la méthode de scalping, permettant de trader au sein des vagues de tendance. Testé sur les principales paires de devises et l'or, il est compatible avec d'autres instruments de trading. Fournit des signaux pour l'ouverture de positions à court terme le long de la tendance, avec un support supplémentaire pour les fluctuations de prix. Principe de l'indicateur : De grandes flèches déterminent la direction de la tendance. Un algorithme de gén
Si vous tradez sur le marché du Forex, disposer d'informations détaillées sur la force des devises et la corrélation entre les paires de devises peut élever votre trading à un niveau supérieur. La corrélation vous aidera à réduire votre risque de moitié, tandis que l'analyse de la force maximisera vos profits. Cet indicateur propose une approche hybride pour sélectionner les paires de devises les plus appropriées en combinant l'analyse de la force des devises et la corrélation des paires. Comme
ACTUELLEMENT 26% DE RÉDUCTION ! !! Cet indicateur est une super combinaison de nos deux indicateurs principaux ( Advanced Currency Strength 28   &  Advanced Currency IMPULSE with ALERT ). Il montre les valeurs de force de la devise pour les TICK-UNITS et les signaux d'alerte pour 28 paires Forex. 11 unités de tic-tac différentes peuvent être utilisées. Ce sont 1, 2, 3, 4, 5, 6, 10, 12, 15, 20 et 30 secondes. La barre de Tick-Unit dans la sous-fenêtre sera affichée et déplacée vers la gauche lo
KURAMA GOLD SIGNAL PRO (MT4) — Système de Trading XAUUSD Complet avec Filtre à 7 Couches, TP/SL Automatique et Notation de Qualité PAS DE REPAINT. PAS DE REDESSIN. PAS DE RETARD. Chaque signal est permanent. Ce que vous voyez est ce que vous obtenez. BONUS : Achetez la licence à vie et recevez AI Zone Radar (valeur $59) + manuel PDF complet GRATUIT. Envoyez-moi un message après l'achat. AI Zone Radar : https://www.mql5.com/en/market/product/175834 CONFIANCE DES TRADERS : Déjà utilisé par une
Master head and shoulders patterns for better trading decisions A head and shoulders pattern is a chart formation that resembles a baseline with three peaks, the outside two are close in height and the middle is highest. It predicts a bullish-to-bearish trend reversal and is believed to be one of the most reliable trend reversal patterns. It is one of several top patterns that signal, with varying degrees of accuracy, that a trend is nearing its end. [ Installation Guide | Update Guide | Trouble
Atomic Analyst
Issam Kassas
5 (5)
Tout d'abord, il convient de souligner que cet indicateur de trading n'est ni repainting, ni redrawing et ne présente aucun délai, ce qui le rend idéal à la fois pour le trading manuel et automatisé. Manuel de l'utilisateur : réglages, entrées et stratégie. L'Analyste Atomique est un indicateur d'action sur les prix PA qui utilise la force et le momentum du prix pour trouver un meilleur avantage sur le marché. Équipé de filtres avancés qui aident à éliminer les bruits et les faux signaux, et à
PZ Double Top Bottom
PZ TRADING SLU
5 (1)
Trade double tops and bottoms effectively The PZ Double Top/Bottom Indicator is a technical analysis tool that helps traders identify potential price reversal patterns in the market. These patterns, known as double tops and bottoms, are characterized by two consecutive peaks or valleys in the price of an asset. Double tops and bottoms are often seen as potential reversal patterns because they can signal a change in the direction of the current trend. [ Installation Guide | Update Guide | Troubl
Apex Break PRO est un indicateur de rupture de lignes de tendance par pivots sans repeinture pour MetaTrader 4. Il détecte les hauts de pivot et les bas de pivot, trace des lignes de tendance dynamiques inclinées entre des pivots consécutifs et génère des signaux d'achat et de vente lorsque le prix franchit ces lignes de tendance lors de la clôture confirmée d'une bougie. Chaque signal est filtré à travers jusqu'à quatre couches de confluence indépendantes — tendance EMA, limites RSI, détection
Gold Scalper Super
Aleksandr Makarov
5 (2)
Gold Scalper Super is an easy-to-use trading system. The indicator can be used as a standalone scalping system on the M1 time frame, as well as part of your existing trading system. Bonus: when purchasing an indicator, Trend Arrow Super is provided free of charge, write to us after purchase. The indicator 100% does not repaint!!! If a signal appears, it does not disappear! Unlike indicators with redrawing, which lead to the loss of a deposit, because they can show a signal and then remove it.
Un indicateur technique qui structure les graphiques et identifie les mouvements de prix cycliques. Peut fonctionner sur n'importe quel graphique. Plusieurs types de notifications. Il y a des flèches supplémentaires sur le graphique lui-même. Sans revenir sur l'histoire, fonctionne sur la fermeture de la bougie. TF recommandé à partir de M5 et plus. Facile à utiliser et à configurer les paramètres. Lorsque vous utilisez 2 indicateurs avec des paramètres différents, vous pouvez les utiliser sans
KuKl
IGOR KIRIANEN
The indicator is built on a non-standard Zig Zag, it draws accumulations after which if the price leaves this zone and a test of this zone occurs, then a sound signal is given and an arrow appears - after the test candle closes.The indicator does not redraw its signals, it is very easy to use, there are only three settings 1- this is the zig zag parameter 2- this is the minimum price exit from the zone 3- this is the maximum price exit from the zone. The lower the parameter for Zig Zag, the more
Plus de l'auteur
Tired of constantly switching between charts to monitor different assets? SX Mini Charts Pro is a powerful, space-saving dashboard indicator that allows you to display up to 8 independent mini-charts directly on your main trading window. Designed for multi-symbol analysis, this indicator keeps all your mini-charts perfectly synced with the timeframe of your main chart, giving you a comprehensive view of the market without cluttering your workspace. Key Features: Multi-Symbol Monitoring: Track
SX Golden MA Pack MT5
Mojtaba Sarikhani
5 (3)
This comprehensive technical indicator calculates and plots up to 3 moving averages with 3 different periods. By employing three moving averages of distinct lookback periods, the trader can confirm whether the market has indeed experienced a change in trend or whether it is merely pausing momentarily before resuming its prior state. SX Golden MA Pack  for MT4 is available   here . The shorter the moving average period, the more closely it tracks the price curve. When a security initiates an upt
FREE
SX Supply Demand Zones accurately identifies and draws high-probability Supply and Demand zones using a sophisticated algorithm. Unlike traditional indicators that clutter your chart, this indicator is designed with a focus on performance and a clean user experience. New Unique Feature: Interactive Legend System What truly sets this indicator apart from everything else is the Interactive Control Legend. You have a professional dashboard directly on your chart that allows you to: Show/Hide: Ins
FREE
SX Golden MA Pack MT4
Mojtaba Sarikhani
5 (1)
This comprehensive technical indicator calculates and plots up to 3 moving averages with 3 different periods. By employing three moving averages of distinct lookback periods, the trader can confirm whether the market has indeed experienced a change in trend or whether it is merely pausing momentarily before resuming its prior state. SX Golden MA Pack  for MT5 is available   here . The shorter the moving average period, the more closely it tracks the price curve. When a security initiates an upt
FREE
SX Trend Impulse Channels is a precisely designed trend-following system that represents trend development through distinct, volatility-adjusted steps. Instead of relying on traditional slope-based methods, it employs a structured step mechanism that only advances when price action conclusively confirms momentum via an ATR-based trigger. This indicator is well suited for traders who favor structured, stair-step trend progression over smooth, continuous curves. It delivers clear momentum-based
FREE
SX Theme Setter MT5
Mojtaba Sarikhani
5 (1)
SX Theme Setter is intended for changing chart appearance in 2 modes: - Gradient background mode: In this mode, the indicator creates a gradient background for your chart. Colors, steps and gradient type can be selected by user. - Color theme: Color theme mode provides more than 50 built-in different color themes which can be selected from a list. Most of these themes are converted from official color themes of real trading platforms of the past and present. Try them out and see if they suit
FREE
SX Theme Setter MT4
Mojtaba Sarikhani
5 (1)
SX Theme Setter is intended for changing chart appearance in 2 modes: - Gradient background mode: In this mode, the indicator creates a gradient background for your chart. Colors, steps and gradient type can be selected by user. - Color theme: Color theme mode provides more than 50 built-in different color themes which can be selected from a list. Most of these themes are converted from official color themes of real trading platforms of the past and present. Try them out and see if they suit
FREE
SX Currency Strength indicator allows users to analyze currency strength through a selected period, with results resetting periodically and accumulating thereafter. It displays the historical relative strength of eight major currencies (USD, EUR, GBP, JPY, AUD, CHF, CAD and NZD) across a selected timeframe. Assessing a currency's relative strength aids in evaluating its performance against a basket of other currencies. Users can select to visualize relative strength of the currencies in the shap
MACD is probably one of the most popular technical indicators out there. When the market is trending, it actually does a pretty good job, but when the market starts consolidating and moving sideways, the MACD performs not so well. SX Impulse MACD for MT5 is available here . Impulse MACD is a modified version of MACD that works very well for trading Forex, stocks, and cryptocurrencies. It has its own unique feature which perfectly filters out the values in a moving average range and enables it t
MACD is probably one of the most popular technical indicators out there. When the market is trending, it actually does a pretty good job, but when the market starts consolidating and moving sideways, the MACD performs not so well. SX Impulse MACD for MT4 is available   here . Impulse MACD is a modified version of MACD that works very well for trading Forex, stocks, and cryptocurrencies. It has its own unique feature which perfectly filters out the values in a moving average range and enables it
Filtrer:
Aucun avis
Répondre à l'avis