Rejoignez notre page de fans
- Vues:
- 51498
- Note:
- Publié:
-
Besoin d'un robot ou d'un indicateur basé sur ce code ? Commandez-le sur Freelance Aller sur Freelance
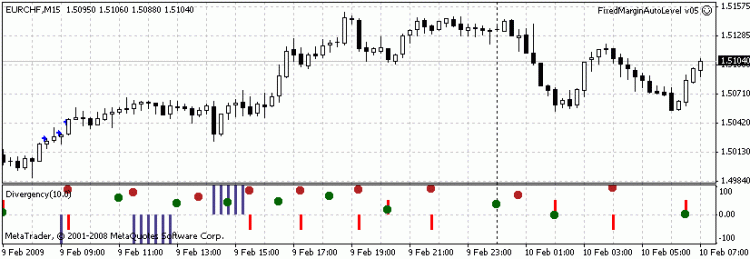
If the blue bar is directed upwards, the price will also go up. Downwards - likewise.
Dots indicate the identified peaks (fractals) of the specified indicator.
Red bars are the maximum peaks (weak signal that the price will "roll back" and slightly move against the trend)
i-Divergency.mq4 - divergence based on stochastic
i-DivMACD.mq4 - divergence based on MACD
If you want to analyze any other indicators - replace the line
Stochastic[CurBuffer]=iStochastic(NULL,0,5,3,3,MODE_EMA,0,MODE_MAIN,CurrentCandle);
with the required one
There can also be false signals. Can't do without them.
Traduit du russe par MetaQuotes Ltd.
Code original : https://www.mql5.com/ru/code/8705
 Channel and the angle of its inclination using the least squares method
It responds to market faster than the MA (moving average)
 ZeroLag MACD Colored
The ZeroLag MACD Colored indicator is a modification of the ZeroLag MACD. Added coloring of the histogram bars relative to the previous bar, if the previous bar is below/above the current.

