 MetaTrader 5
 Experts
 Indicateurs
 Scripts
 Bibliothèque
 Stockage
Voir comment télécharger gratuitement des robots de trading
Retrouvez-nous sur Telegram !
Rejoignez notre page de fans
Rejoignez notre page de fans
Vous avez aimé le script ? Essayez-le dans le terminal MetaTrader 5

False Breakout Envelope - indicateur pour MetaTrader 5
Bruno Nunes Myrrha Ribeiro

🆓 FREE SOURCE CODE
-
🤖 EXPERT ADVISORS
► Awesome Oscillator Pullback EA for EURUSD:
https://www.mql5.com/en/code/78891
► Stochastic Daily Breakout for Gold:
-
🤖 EXPERT ADVISORS
► Awesome Oscillator Pullback EA for EURUSD:
https://www.mql5.com/en/code/78891
► Stochastic Daily Breakout for Gold:
- Vues:
- 78
- Publié:
-
 Vous manquez des opportunités de trading :
- Applications de trading gratuites
- Plus de 8 000 signaux à copier
- Actualités économiques pour explorer les marchés financiers
Inscription Se connecterVous acceptez la politique du site Web et les conditions d'utilisation
Si vous n'avez pas de compte, veuillez vous inscrire -
 Besoin d'un robot ou d'un indicateur basé sur ce code ? Commandez-le sur Freelance
Aller sur Freelance
Price spikes through a volatility band, fails to hold and closes back inside. It is one of the oldest reversal setups on the chart, and one of the hardest to trust: how often does it really work on this symbol, and under what conditions? This indicator draws an ATR envelope, flags every false break of it, lays each one out as a trade from the entry to the midline with its stop, and keeps score. Every label prints the win rate of earlier signals on the same side that fired in the same RSI zone.
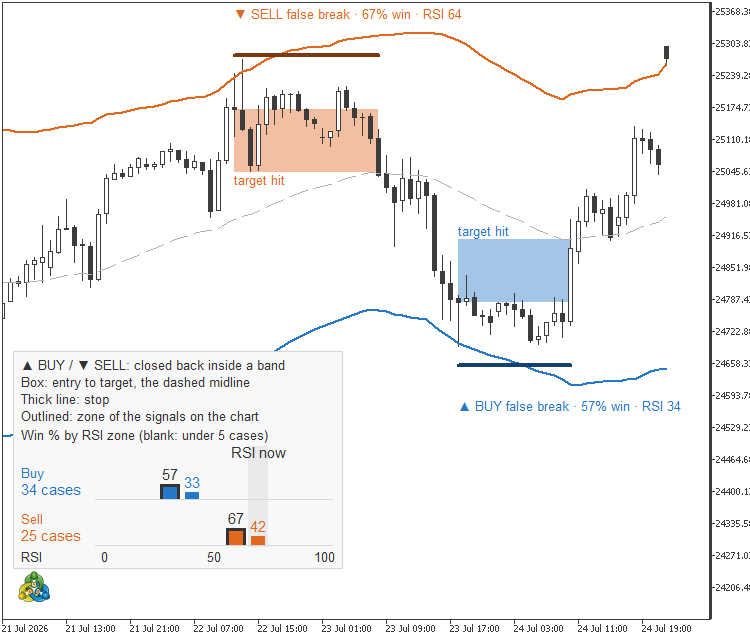
Every signal is a box
A signal is painted as a box behind the candles, from the close of the signal bar to the target, in the color of its side. A thick line on the opposite side marks the stop: the extreme of the signal bar and the bar before it, plus half an ATR(100) of padding, which you can change. The box stays open until price reaches the target or trades past the stop, and then it ends on that bar. A tag on the target edge tells the outcome: target while it is open, target hit or stopped out once it resolves. A box that reached the target is darker and a stopped one turns pale, so a look along the history shows how the setup has behaved here. Only one signal per side is open at a time.
Boxes never stack. When a newer box shares bars and prices with an older one, the older box ends on the bar before the new signal, and both stay readable.
A target that moves with the average
The target is the midline of the envelope, and it is a live target. On every bar the box updates its far edge to the midline of the previous bar instead of freezing the value of the signal bar, so it never points at a level the average has already left behind. A signal resolves from the bar after its own, whatever happens on the other side. If one bar touches both the midline and the stop, it counts as a hit, the same convention for every signal in the tally.
A win rate on every label
Each label sits beyond the stop, clear of the candles, and reads in one line, for example ▼ SELL false break · 67% win · RSI 64. The rate belongs to the side of the signal and to the RSI(20) zone where it fired, in 11 steps from 0 to 10, so a sell with an RSI of 85 is compared only with earlier sells in that same zone. A rate appears only after five resolved cases in the zone, an input; below that the label shows the count alone, such as 3/4 won so far, because one lucky case should not look like a certainty. Hover over a label to see the zone and how many earlier signals reached the midline.
The card: where it works
The corner card opens with a legend of every mark on the chart, then draws the win % by RSI zone: one column per zone for each side, as tall as the rate and topped by the number. A zone under the minimum sample stays blank, and each side prints how many cases it has resolved. The columns of the signals on the chart are outlined and carry the same number as their labels, so the label and the statistics behind it sit side by side. A light column marked RSI now follows the current zone. In a few seconds you see whether this symbol and timeframe reward the setup only near the RSI extremes, only in the middle, or nowhere at all. The card takes the lower left corner and moves to the upper one when candles or bands would run under it.
What counts as a false break
The envelope is an exponential moving average of the close, 55 bars by default, with a band on each side at 4 average true ranges of the same length. A sell signal needs a bar that closes back below the upper band after being above it: either its high pierced the band while the previous close was still under it, or the previous close was already above it. The run of bars with highs above the band before that return must not be longer than 10 bars, so a long trend outside the band is never called a false break. The buy signal is the mirror image on the lower band. Two signals, on either side, are at least 10 bars apart.
For Expert Advisors
The upper band, the lower band and the midline are available through iCustom and CopyBuffer as buffers 4, 5 and 6. Closed bars write the history; the bar in progress is applied to a copy of that state on every tick, so a signal on the forming bar can disappear until the bar closes, while nothing already drawn on closed bars is rewritten. Signals are tracked over the last 5,000 bars and up to 500 stay on the chart. When that book is full, the oldest finished signal makes room, so the newest ones are always drawn, while the win rate tables keep counting everything.
Inputs
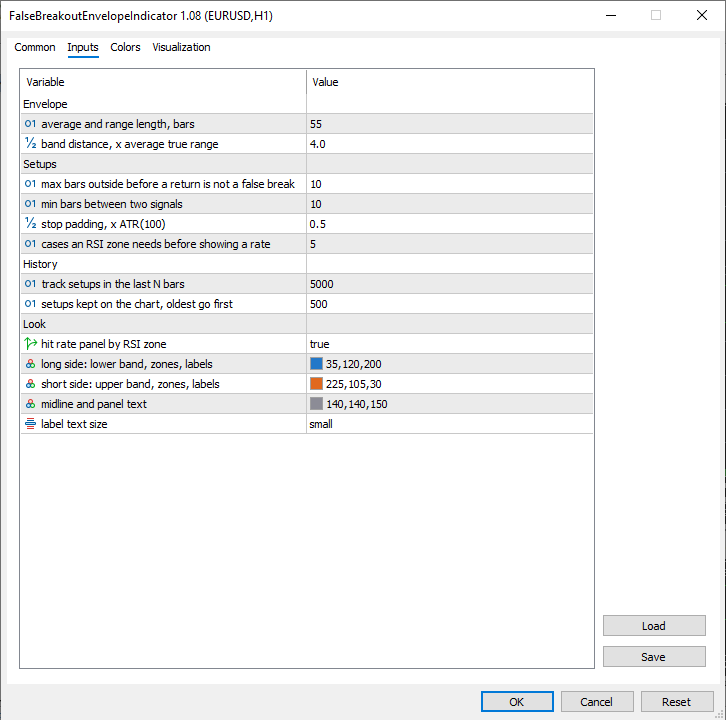
- Envelope: average and range length (55); band distance in ATRs (4.0).
- Setups: max bars outside before a return is not a false break (10); min bars between two signals (10); stop padding in ATR(100) (0.5); cases an RSI zone needs before showing a rate (5).
- History: bars tracked (5,000); setups kept on the chart (500).
- Look: hit rate panel by RSI zone (on); colors of the long side, the short side and the midline; label text size (small).
Works on any symbol and timeframe, and removing the indicator deletes everything it drew.
Educational content, not financial advice. Trading involves risk of loss.
Auto Fibonacci Retracement on the Latest Swing
Detects swing highs and lows automatically and draws Fibonacci retracement levels on the latest completed swing leg. The levels move to the new leg as soon as a new swing is confirmed; the levels, their colors and the swing sensitivity are configurable.
 Risk Lot Calculator - lot size from risk percent and stop distance
Small include file that gives you the lot size from risk in percent (or fixed money) and the stop loss distance. Rounds always down, checks min/max lot and free margin.
Prop Firm News Window Countdown and Spread Monitor
Tracks live MQL5 economic calendar events and real-time Bid-Ask spread in a chart HUD, exposing three iCustom buffers for EA news and spread gating.
Session Boxes with DST-correct clocks
Tokyo, London and New York session boxes with high-low range, kept on the right hours through every clock change, plus a live clock panel.