 MetaTrader 5
 Experts
 Indicateurs
 Scripts
 Bibliothèque
 Stockage
Voir comment télécharger gratuitement des robots de trading
Retrouvez-nous sur Facebook !
Rejoignez notre page de fans
Rejoignez notre page de fans
Vous avez aimé le script ? Essayez-le dans le terminal MetaTrader 5

Auto Fibonacci Retracement on the Latest Swing - indicateur pour MetaTrader 5

- Vues:
- 83
- Note:
- Publié:
-
 Vous manquez des opportunités de trading :
- Applications de trading gratuites
- Plus de 8 000 signaux à copier
- Actualités économiques pour explorer les marchés financiers
Inscription Se connecterVous acceptez la politique du site Web et les conditions d'utilisation
Si vous n'avez pas de compte, veuillez vous inscrire -
 Besoin d'un robot ou d'un indicateur basé sur ce code ? Commandez-le sur Freelance
Aller sur Freelance

Auto Fibonacci Retracement on the Latest Swing
The idea behind it
Fibonacci retracements are among the most widely used tools of technical analysis: after a price swing the market often pulls back by a certain fraction of that swing (23.6%, 38.2%, 50%, 61.8%, 78.6%) before the move continues. Drawing them by hand is slow and subjective, because the trader has to choose the two anchor points of the swing every time.
This indicator does it automatically in three steps:
- Swing points. A bar is a swing high if its high is the highest of InpSwingLeft bars to the left and InpSwingRight bars to the right; a swing low is defined in the same way with the lows.
- Latest leg. The swing points are kept alternating (high, low, high, …). The last two points form the latest swing leg. If two swing points of the same kind follow each other, the more extreme one is kept.
- Levels. The levels are drawn on the leg: 0% at the end of the leg (the latest swing point) and 100% at its start. A level of 38.2% is therefore the price that has retraced 38.2% of the leg back toward its start. Values above 100% or below 0% are also possible.
A swing point is confirmed only after InpSwingRight bars have closed after it, so the leg is always built from completed, non-repainting swing points.
How to interpret it
- Dots – the detected swing points: above the bar for swing highs, below the bar for swing lows (optional).
- Dotted line – the latest swing leg that joins its two swing points.
- Horizontal lines – the Fibonacci levels. The lines at 0% and 100% are solid, the inner levels are dashed. The lines start at the beginning of the leg and can be extended to the right.
- Labels – every line has a label with the level in percent and its price (optional).
- Direction – after an up leg (the leg ends with a swing high) the levels lie below the high and show potential support of a pullback; after a down leg (the leg ends with a swing low) they lie above the low and show potential resistance.
- Info label (upper-left corner) – the direction of the latest swing, its start and end prices, and the current retracement of the last price in percent. Values above 100% mean that price has moved beyond the start of the leg; negative values mean that price has moved beyond its end.
- A new swing – when a new opposite swing point is confirmed, the old leg is replaced and all lines and labels move to the new leg.
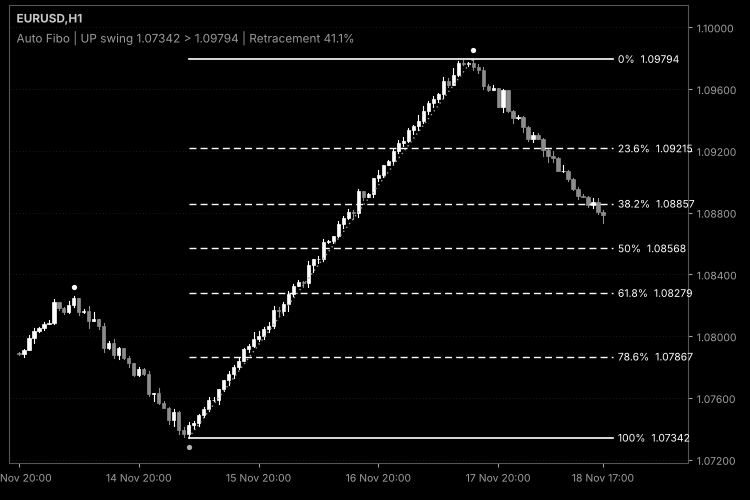
Fig. 1. Auto Fibonacci Retracement on an H1 chart: the latest up leg with its levels and labels, swing points marked with dots; black & white image per Code Base image guidelines (colors are configurable).
External variables (inputs)
| Input | Default | Purpose |
|---|---|---|
| InpSwingLeft | 5 | Number of bars to the left of a swing point that must have a lower high (or a higher low). 1 or more. |
| InpSwingRight | 5 | Number of bars to the right that must have a lower high (or a higher low); also the delay after which a swing is confirmed. 1 or more. |
| InpMinLegPoints | 0 | Minimum size of a swing leg in points; smaller legs are ignored. 0 disables the filter. |
| InpHistoryBars | 3000 | Number of latest bars in which swings are searched when the indicator is loaded (100 or more). |
| InpLevels | 0,23.6,38.2,50,61.8,78.6,100 | Levels in percent, separated by commas (1 to 12 values). Values such as -27.2 or 161.8 draw levels beyond the leg. |
| InpExtendRight | true | Extends the level lines to the right and puts the labels next to the last bar. |
| InpShowLabels | true | Shows a label with the level and its price for every line. |
| InpLevelColor | clrGoldenrod | Color of the level lines and their labels. |
| InpLegColor | clrGray | Color of the line that joins the two swing points. |
| InpShowPivots | true | Marks the swing highs and lows with dots. |
| InpShowInfoLabel | true | Shows the label with the swing and the current retracement. |
| InpLabelColor | clrSilver | Color of the info label. |
The colors of the swing dots can be changed on the "Colors" tab of the indicator properties.
Recommended use
- Symbols and timeframes: works on any symbol and timeframe. Small InpSwingLeft/InpSwingRight values find short-term swings and change the leg often; larger values give fewer, more significant swings but confirm them later. Use InpMinLegPoints to ignore small legs in quiet markets.
- Confirmation delay: because a swing point needs InpSwingRight closed bars after it, the leg is always a little behind the market. The last extreme is not part of the leg until it has been confirmed; this is the price of levels that do not repaint.
- Levels: Fibonacci levels are not guaranteed turning points; many traders use them together with support and resistance, candle patterns or other indicators. The list of levels can be changed freely, for example 0,38.2,61.8,100,161.8.
- Caveats: the latest leg is chosen mechanically and may differ from the swing a trader would choose by eye. When price makes a new extreme in the direction of the leg before a pullback is confirmed, the leg end is updated only after the new swing is confirmed.
- Calculation: each bar is checked as a swing candidate only once, after its right-hand bars have closed; after the first calculation only new bars are examined. The objects are redrawn only when the leg changes and on a new bar.
- Account types: the indicator does not trade and works identically on netting and hedging accounts.
- All objects (lines, labels, the info label) are created with a unique prefix and removed when the indicator is deleted or reinitialized. Use the levels as additional context together with your own entry rules and risk management.
 Risk Lot Calculator - lot size from risk percent and stop distance
Small include file that gives you the lot size from risk in percent (or fixed money) and the stop loss distance. Rounds always down, checks min/max lot and free margin.
 Closed Trades to CSV - one row per closing deal (partial closes, reversals)
Exports closed trades to a CSV file, one row per closing deal: partial closes, close-by and netting reversals are split, each row with the position's open time, volume-weighted open price and its share of the entry commission.
False Breakout Envelope
False breaks at an ATR envelope, drawn as trades: price pushes through a band, closes back inside, and a box runs from the entry to the moving midline, with the stop as a thick line. Each label prints the win rate of earlier signals in the same RSI zone, and a corner card charts it for every zone.
Prop Firm News Window Countdown and Spread Monitor
Tracks live MQL5 economic calendar events and real-time Bid-Ask spread in a chart HUD, exposing three iCustom buffers for EA news and spread gating.