 MetaTrader 5
 Experts
 Indicateurs
 Scripts
 Bibliothèque
 Stockage
Voir comment télécharger gratuitement des robots de trading
Retrouvez-nous sur Telegram !
Rejoignez notre page de fans
Rejoignez notre page de fans
Vous avez aimé le script ? Essayez-le dans le terminal MetaTrader 5

Session VWAP with Standard Deviation Bands - indicateur pour MetaTrader 5

- Vues:
- 101
- Note:
- Publié:
-
 Vous manquez des opportunités de trading :
- Applications de trading gratuites
- Plus de 8 000 signaux à copier
- Actualités économiques pour explorer les marchés financiers
Inscription Se connecterVous acceptez la politique du site Web et les conditions d'utilisation
Si vous n'avez pas de compte, veuillez vous inscrire -
 Besoin d'un robot ou d'un indicateur basé sur ce code ? Commandez-le sur Freelance
Aller sur Freelance

Session VWAP with Standard Deviation Bands
The idea behind it
VWAP (Volume Weighted Average Price) is the average price of a session in which every bar counts in proportion to its traded volume. Busy bars move the average more than quiet ones, so VWAP approximates the "fair" price the market has actually transacted at since the session opened. Institutions often use it as an execution benchmark, which is why many traders watch it as a magnet and a dynamic support/resistance level.
A single line says nothing about how far price is allowed to wander. This indicator therefore also calculates the volume-weighted standard deviation of the same price series and draws bands at a configurable number of deviations above and below VWAP. Price sitting at +2 SD is statistically stretched relative to the session so far; price returning to VWAP is a mean-reversion signal; price riding the outer band is a sign of a strong trend.
Everything is accumulated from the session open and updated incrementally with a numerically stable (Welford-type) weighted algorithm, so only the last bar is recalculated on each tick.
How to interpret it
- VWAP (solid, thick line) – the volume-weighted average price since the session start.
- Upper / Lower band 1 (dashed lines) – VWAP ± InpMult1 standard deviations (default 1.0 SD). Price spends most of its time between these lines in a balanced session.
- Upper / Lower band 2 (dotted lines) – VWAP ± InpMult2 standard deviations (default 2.0 SD). Touches of this zone are comparatively rare and mark extended moves.
- Vertical dotted lines – the start of each session, where all running sums are reset. The lines are also broken at the session open, so sessions are never joined by a false connecting segment.
- Info label (top-left corner) – current VWAP, current standard deviation and the Z-score of the last price: Z = (Price − VWAP) / SD. A Z-score of +2 means price is two deviations above VWAP.
Early in a session the bands are very narrow (the first bar has a deviation of zero) and widen as more data accumulates; this is normal behavior of a cumulative statistic.
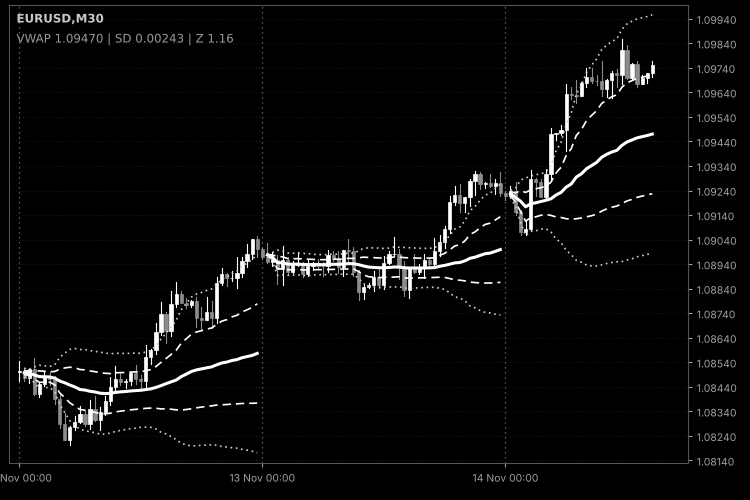
Fig. 1. Session VWAP (solid), ±1 SD (dashed) and ±2 SD (dotted) with session separators; black & white image per Code Base image guidelines (colors are configurable in the indicator properties).
External variables (inputs)
| Input | Default | Purpose |
|---|---|---|
| InpSession | Daily | Session reset period: Daily, Weekly (starts Monday) or Monthly. |
| InpStartHour | 0 | Hour of the session start in server time (0–23). |
| InpStartMinute | 0 | Minute of the session start (0–59). |
| InpPrice | PRICE_TYPICAL | Price taken from each bar: typical price (H+L+C)/3, close, median, weighted, open, high or low. |
| InpVolume | VOLUME_TICK | Volume used as the weight: tick volume or real volume (if the broker provides it). |
| InpMult1 | 1.0 | Multiplier of the inner bands in standard deviations; must be greater than zero. |
| InpMult2 | 2.0 | Multiplier of the outer bands in standard deviations; must be greater than zero. |
| InpHistoryBars | 5000 | Number of latest bars calculated on load; 0 calculates the whole history. |
| InpGapBetweenSessions | true | Leaves the first bar of every session empty so that lines of different sessions are not connected. |
| InpDrawSessionLines | true | Draws a vertical dotted line at each session start. |
| InpSessionLineColor | clrDimGray | Color of the session lines. |
| InpShowInfoLabel | true | Shows the VWAP / SD / Z-score label in the upper-left corner. |
| InpLabelColor | clrGray | Color of the info label. |
Recommended use
- Timeframes: use a timeframe clearly smaller than the session – M1–H1 for the daily session, H1–H4 for weekly, H4–D1 for monthly. On D1 with a daily session each session is a single bar, and the indicator prints a warning to the Experts log.
- Volume type: forex and CFD symbols normally provide tick volume only, which is a reasonable proxy for activity. Real volume (InpVolume = VOLUME_REAL) is meaningful on exchange-traded instruments (futures, stocks); if the broker supplies none, bars with zero weight are skipped and the indicator shows nothing until volume appears.
- Session start: the start time is entered in server time. Adjust it to the market of interest, for example to the open of the cash session of an index. Weekly sessions begin on Monday at the chosen time.
- History limit: if the first session in the calculated range is cut by InpHistoryBars, its VWAP is calculated only from the first loaded bar. Increase the value or set it to 0 for complete sessions on the left of the chart.
- Account types: the indicator does not trade and works identically on netting and hedging accounts.
- Caveats: the standard deviation describes the dispersion of bar prices around VWAP, not a probability of reversal. The session start is not tied to news or events, and in strong trends price can stay beyond +2 SD for a long time. Use the levels as context, together with your own entry rules and risk management.
- The indicator creates chart objects (vertical lines and a label) with a unique prefix and removes only its own objects when it is deleted or reinitialized.
Anchored VWAP with Draggable Anchor Point
Anchored VWAP with a draggable anchor line: drag the vertical line to any bar and the volume-weighted average price and its deviation bands are rebuilt from that bar onward.
Opening Range Breakout (ORB) Box with Breakout Arrows
An indicator that draws the opening range of each trading day as a box, extends its high and low through the session, and marks the first breakout with a buy or sell arrow.
Tick Volume Delta Histogram (Buy/Sell Pressure Estimate)
Estimates buy/sell pressure by splitting the tick volume of every bar into a buy part and a sell part. The difference (delta) is shown as a four-color histogram with an optional EMA line.
 One-Click Close All Positions with Slippage Guard
Execution-safe utility script to close open positions in one click with configurable slippage deviation, spread guard protection, symbol/P&L/Magic filters, and automatic retry handling.