 MetaTrader 5
 Experts
 Indicateurs
 Scripts
 Bibliothèque
 Stockage
Voir comment télécharger gratuitement des robots de trading
Retrouvez-nous sur Facebook !
Rejoignez notre page de fans
Rejoignez notre page de fans
Vous avez aimé le script ? Essayez-le dans le terminal MetaTrader 5

Anchored VWAP with Draggable Anchor Point - indicateur pour MetaTrader 5

- Vues:
- 87
- Note:
- Publié:
-
 Vous manquez des opportunités de trading :
- Applications de trading gratuites
- Plus de 8 000 signaux à copier
- Actualités économiques pour explorer les marchés financiers
Inscription Se connecterVous acceptez la politique du site Web et les conditions d'utilisation
Si vous n'avez pas de compte, veuillez vous inscrire -
 Besoin d'un robot ou d'un indicateur basé sur ce code ? Commandez-le sur Freelance
Aller sur Freelance

Anchored VWAP with Draggable Anchor Point
The idea behind it
The Volume Weighted Average Price (VWAP) shows the average price paid by the market, where every bar counts in proportion to the volume traded in it. A regular VWAP restarts at fixed moments (for example, every day). An anchored VWAP instead starts at a bar that you choose, usually a bar that mattered: a swing high or low, a news release, a gap, a breakout or the start of a trend.
From that anchor bar the indicator accumulates price × volume and volume, so the line reads as the average entry price of everyone who traded since the event. When price trades above it, the buyers since the anchor are on average in profit; below it, the sellers are. The line often acts as dynamic support or resistance.
The anchor is a normal vertical line on the chart. Drag it with the mouse and the whole indicator is recalculated immediately, with no need to open the properties dialog or wait for the next tick. The calculation is incremental: running sums are stored per bar, so on a new tick only the last bar is recomputed, and a full pass is made only when the anchor moves or the history changes.
How to interpret it
- Dashed vertical line: the anchor. The VWAP starts at the bar that contains this line. Nothing is drawn to the left of it.
- Solid thick line (AVWAP): the volume-weighted average price accumulated from the anchor bar to the current bar.
- Dashed lines (Upper 1 / Lower 1): AVWAP ± Band 1 multiplier × the volume-weighted standard deviation of price since the anchor.
- Dotted lines (Upper 2 / Lower 2): the same, using the Band 2 multiplier. They mark stretched, statistically extreme prices relative to the anchored average.
- Price above the AVWAP and the AVWAP rising: buyers who entered after the anchor are in control. Price below a falling AVWAP: sellers are in control.
- A pullback to the AVWAP or to the first band that holds is often used as a place to look for continuation; a close beyond the second band shows an extended move.
- The bands are not fixed in width: they widen when the price has been dispersed since the anchor and narrow when it has stayed close to the average.
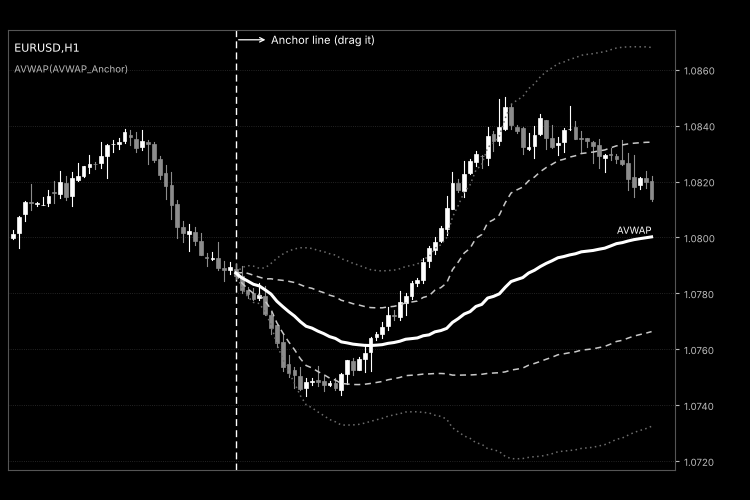
Fig. 1. Anchored VWAP on EURUSD H1: anchor line (dashed vertical), AVWAP (solid), deviation bands (dashed and dotted). The image is black & white according to the Code Base image guidelines; the line colors on a real chart are configurable.
External variables (inputs)
| Input | Default | Purpose |
|---|---|---|
| Anchor | ||
| InpAnchorName | AVWAP_Anchor | Name of the anchor line object. Use a different name for every instance of the indicator on the same chart. |
| InpInitialBarsBack | 100 | Where the anchor is placed the first time, counted in bars back from the last bar. An existing line with the same name is reused instead. |
| InpSnapToBar | true | After a drag, moves the line to the open time of the nearest bar so that it sits exactly on a bar. |
| InpAnchorColor | clrOrange | Color of the anchor line. |
| InpAnchorStyle | STYLE_DASH | Style of the anchor line. |
| InpAnchorWidth | 1 | Width of the anchor line (1 to 5). |
| Calculation | ||
| InpPriceType | AVWAP_PRICE_TYPICAL | Price of each bar used in the average: typical (H+L+C)/3, close, open, high, low, median (H+L)/2 or weighted (H+L+2C)/4. |
| InpVolumeType | AVWAP_VOL_TICK | Volume used as the weight: tick volume, or real volume. If a bar has no real volume, its tick volume is used instead. |
| Bands | ||
| InpShowBands | true | Shows or hides the four deviation bands. |
| InpBandMult1 | 1.0 | Multiplier of the volume-weighted standard deviation for the first pair of bands. Must be greater than 0. |
| InpBandMult2 | 2.0 | Multiplier of the volume-weighted standard deviation for the second pair of bands. Must be greater than 0. |
Recommended use
- Moving the anchor. The line is created selected. If it is not selected, double-click it first, then drag it along the time axis. With InpSnapToBar enabled it jumps to the nearest bar when released. Dragging it beyond the last bar places it on the current bar. If you delete the line, the indicator recreates it at its last position on the next tick.
- Several anchors. Attach the indicator more than once and give each copy its own InpAnchorName (for example, one anchor on a swing low and one on a swing high).
- Volume source. On Forex and CFD symbols the terminal provides tick volume only, which is a proxy for activity and not for traded lots, so the VWAP is an approximation there. On exchange symbols with real volume, set InpVolumeType to AVWAP_VOL_REAL .
- Timeframes. It works on any timeframe. Pick the anchor on a higher timeframe and watch the line on a lower one for entries; the anchor keeps its time when you switch timeframes. If the anchor lies before the first available bar, the calculation starts from the first bar.
- Anchor in the future. If the anchor time is later than the current bar (for example, when edited in the object properties and snapping is disabled), nothing is drawn until that bar appears.
- Removing the indicator. Taking the indicator off the chart deletes the anchor line. The line is kept when the indicator is only reloaded (timeframe or symbol change, new inputs, recompilation, template load, terminal restart).
- Account types. It is a visual indicator: it does not trade, does not need DLLs and works the same on netting and hedging accounts.
- The VWAP is a context tool and is not a signal by itself. Combine it with your own entry rules and risk management.
Opening Range Breakout (ORB) Box with Breakout Arrows
An indicator that draws the opening range of each trading day as a box, extends its high and low through the session, and marks the first breakout with a buy or sell arrow.
Mouteki DeMark Enhanced with FDI and Hurst Exponent - indicator for MetaTrader 5
Mouteki-DeMark trendline indicator enhanced with FDI and Hurst Exponent analysis, breakout targets, a market dashboard, and signal, invalidation and early-close alerts.
Session VWAP with Standard Deviation Bands
Session-anchored VWAP with volume-weighted standard deviation bands. It restarts at every daily, weekly or monthly session open and shows how far price has stretched from the average price paid during the session.
Tick Volume Delta Histogram (Buy/Sell Pressure Estimate)
Estimates buy/sell pressure by splitting the tick volume of every bar into a buy part and a sell part. The difference (delta) is shown as a four-color histogram with an optional EMA line.