 MetaTrader 5
 Experts
 Indicateurs
 Scripts
 Bibliothèque
 Stockage
Voir comment télécharger gratuitement des robots de trading
Retrouvez-nous sur Twitter !
Rejoignez notre page de fans
Rejoignez notre page de fans
Vous avez aimé le script ? Essayez-le dans le terminal MetaTrader 5

Opening Range Breakout (ORB) Box with Breakout Arrows - indicateur pour MetaTrader 5

- Vues:
- 100
- Note:
- Publié:
-
 Vous manquez des opportunités de trading :
- Applications de trading gratuites
- Plus de 8 000 signaux à copier
- Actualités économiques pour explorer les marchés financiers
Inscription Se connecterVous acceptez la politique du site Web et les conditions d'utilisation
Si vous n'avez pas de compte, veuillez vous inscrire -
 Besoin d'un robot ou d'un indicateur basé sur ce code ? Commandez-le sur Freelance
Aller sur Freelance

ORB Box - Opening Range Breakout with Breakout Arrows
The idea behind it
The first minutes of a trading session are often the most active: overnight orders, news and the first institutional flows meet in a short time. The high and the low printed during this period form the opening range. Many traders treat it as a reference zone for the rest of the day: while price stays inside, the market is still undecided; a move beyond the range suggests that one side has taken control.
ORB Box automates this routine. For every day it measures the high and low of a configurable time window (for example 09:00-09:30), draws them as a box and extends the two levels until the end of the session. When a bar breaks out of the range, an arrow is placed on it. Nothing is traded by the indicator; it only shows where the breakout happened, so the setup can be reviewed on history and used for alerts.
How to interpret it
- Dashed box - the opening range. Its width is the time window, its height is the lowest low to the highest high inside the window. The box grows while the range is forming and stays fixed afterwards.
- Dotted horizontal lines - the range high and range low, continued from the end of the box up to the session end time. They are the breakout levels.
- Up arrow under a bar - buy breakout: the bar closed above the range high (or its High went above it, depending on the selected trigger), plus the optional buffer.
- Down arrow above a bar - sell breakout: the bar closed below the range low (or its Low went below it), minus the optional buffer.
- One signal per day (default) - after the first breakout of the day no further arrows are drawn. Disable InpFirstBreakoutOnly to get at most one buy and one sell per day, which also shows reversals through the opposite side of the range.
- Data buffers - for use with iCustom() in an Expert Advisor: 0 = buy arrow price, 1 = sell arrow price, 2 = range high, 3 = range low. Unused values equal EMPTY_VALUE.
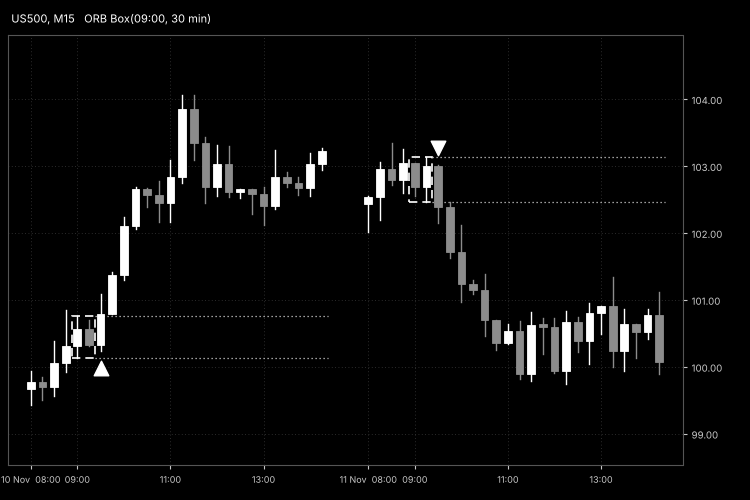
Fig. 1. ORB Box on an M15 chart: a buy breakout on the first day and a sell breakout on the second day (black and white image, as required by the Code Base image guidelines).
External variables (inputs)
| Input | Default | Purpose |
|---|---|---|
| Opening range (broker server time) | ||
| InpStartHour | 9 | Hour at which the opening range starts (0-23). |
| InpStartMinute | 0 | Minute at which the opening range starts (0-59). |
| InpRangeMinutes | 30 | Duration of the opening range in minutes. It is rounded up to a whole number of bars of the current timeframe (30 minutes on H1 becomes one 60-minute bar). |
| InpSessionEndHour | 17 | Hour at which the session ends; no levels or signals after this time (0-23). |
| InpSessionEndMinute | 0 | Minute at which the session ends (0-59). |
| Breakout rules | ||
| InpBreakMode | ORB_BREAK_CLOSE | Breakout trigger: ORB_BREAK_CLOSE - the bar close is beyond the range; ORB_BREAK_WICK - the bar High/Low is beyond the range. |
| InpBreakBufferPoints | 0 | Additional distance in points that price must travel beyond the range to count as a breakout. Helps to filter small false breakouts. |
| InpFirstBreakoutOnly | true | true - only the first breakout of each day is marked; false - the first breakout in each direction. |
| Drawing | ||
| InpDaysToDraw | 10 | Number of most recent days for which the box is drawn. Older boxes are deleted to keep the chart light. Arrows and levels are calculated for the whole available history. |
| InpBoxColor | clrDodgerBlue | Color of the box. |
| InpBoxStyle | STYLE_DASH | Border style of the box. |
| InpBoxWidth | 1 | Border width of the box. |
| InpFillBox | false | Fill the box with color (drawn behind the candles). |
| InpLevelColor | clrSilver | Color of the dotted range high and low lines. |
| InpBuyColor | clrLime | Color of the buy arrows. |
| InpSellColor | clrRed | Color of the sell arrows. |
| InpArrowSize | 2 | Arrow size (1-5). |
| InpArrowOffsetPoints | 30 | Distance in points between the arrow and the breakout bar. |
| Alerts | ||
| InpAlertPopup | true | Show a pop-up alert. |
| InpAlertSound | false | Play the standard alert sound. |
| InpAlertPush | false | Send a push notification to the mobile terminal (requires MetaQuotes ID in the terminal settings). |
| InpAlertEmail | false | Send an e-mail (requires e-mail settings in the terminal). |
Recommended use
- Time zone. All times are in broker server time, not local or exchange time. Check the server time in the Market Watch window and shift the start hour accordingly. Brokers that follow daylight saving time move their server time twice a year, so the start hour may need to be adjusted then.
- Symbols. The idea works best on instruments with a clear session open: stock indices, futures-based CFDs, gold, oil and FX pairs around the London or New York open. On symbols that trade around the clock without a defined open the range has little meaning.
- Timeframes. M5-M30 are the natural choice, and H1 also works. The range is always rounded up to whole bars, so it is exact on any chart; a message in the Experts tab tells you when it was rounded. The range must start at the open time of a bar, so on H1 or higher use a start minute that matches the bar opening times. Daily and higher timeframes have no intraday range and nothing is drawn there.
- Same-day sessions only. The range and the session end must be on the same calendar day of server time. Sessions that cross midnight are not supported.
- History. Make sure enough bars are loaded for the number of days you want to review. Days with no bars inside the opening range are skipped.
- Repainting. With the close trigger the arrow on the still forming bar can appear and disappear until that bar closes. Alerts are sent only for the last closed bar, so they are not affected. Signals on closed bars do not change.
- Accounts. The indicator does not place orders and works the same on hedging and netting accounts. If you use its buffers in an Expert Advisor, account for spread, slippage and the fact that the signal bar is already closed when the arrow is final.
- Not a trading system. Breakouts often fail in quiet or range-bound markets. Combine the signals with a trend filter, news calendar and risk management, and test any rules on history first.
Mouteki DeMark Enhanced with FDI and Hurst Exponent - indicator for MetaTrader 5
Mouteki-DeMark trendline indicator enhanced with FDI and Hurst Exponent analysis, breakout targets, a market dashboard, and signal, invalidation and early-close alerts.
 Spread Statistics by Hour
Historical spread statistics by hour for many symbols at once (median, 75th percentile, mean), exported to CSV. Does not trade.
Anchored VWAP with Draggable Anchor Point
Anchored VWAP with a draggable anchor line: drag the vertical line to any bar and the volume-weighted average price and its deviation bands are rebuilt from that bar onward.
Session VWAP with Standard Deviation Bands
Session-anchored VWAP with volume-weighted standard deviation bands. It restarts at every daily, weekly or monthly session open and shows how far price has stretched from the average price paid during the session.