 MetaTrader 5
 Experts
 Indicateurs
 Scripts
 Bibliothèque
 Stockage
Voir comment télécharger gratuitement des robots de trading
Retrouvez-nous sur Twitter !
Rejoignez notre page de fans
Rejoignez notre page de fans
Vous avez aimé le script ? Essayez-le dans le terminal MetaTrader 5

Equity/Drawdown Monitor Panel - indicateur pour MetaTrader 5

- Vues:
- 87
- Note:
- Publié:
-
 Vous manquez des opportunités de trading :
- Applications de trading gratuites
- Plus de 8 000 signaux à copier
- Actualités économiques pour explorer les marchés financiers
Inscription Se connecterVous acceptez la politique du site Web et les conditions d'utilisation
Si vous n'avez pas de compte, veuillez vous inscrire -
 Besoin d'un robot ou d'un indicateur basé sur ce code ? Commandez-le sur Freelance
Aller sur Freelance

Equity/Drawdown Monitor Panel
The idea behind it
Every chart shows you price. Almost none show you the number that actually decides whether you're still in the game: how far your equity has fallen from its own high-water mark. Balance alone hides it — balance only moves on closed trades, so it can look calm while floating losses on open positions are quietly doing real damage to equity. This panel tracks equity's own peak as it happens and reports the live drawdown from that peak as a plain percentage, so the number you actually need is sitting on the chart instead of buried in a terminal tab you have to go check.
It reads account data directly — there's no per-bar history to scan, since equity and balance are always just the current account snapshot. The only thing worth being efficient about is not redrawing the panel on ticks where nothing actually changed, which is exactly what it does.
How to interpret it
- Equity — your current account value including floating profit/loss on open positions.
- Balance — your account value from closed trades only, with no floating P/L included.
- Peak — the highest equity value tracked since the indicator was attached (or since the last daily reset, if enabled).
- Drawdown — how far current equity sits below that tracked peak, as a percentage.
- The panel text turns from silver to red once drawdown crosses your configured threshold — a visual flag that works whether or not you've also turned on the alert.
- With the alert enabled, crossing the threshold fires one Experts-log entry and terminal alert, then re-arms only after equity recovers back inside the re-arm band — so it won't fire again on every tick while you're sitting right at the edge.
External variables (inputs)
| Input | Default | Purpose |
|---|---|---|
| InpResetPeakDaily | false | Reset the tracked equity peak at the start of each new trading day. When off, the peak is tracked continuously since the indicator was attached. |
| InpAlertOnDrawdown | false | Enable a one-shot alert when drawdown-from-peak crosses InpDrawdownAlertPercent. |
| InpDrawdownAlertPercent | 10.0 | Drawdown percentage, from peak equity, that counts as alert-worthy. Also used to flag the panel red regardless of whether alerts are on. |
| InpRearmPercent | 5.0 | Drawdown must recover back below this percentage before the same threshold can alert again. |
| InpCorner | CORNER_LEFT_UPPER | Chart corner the readout panel is anchored to. |
| InpCornerX | 20 | Panel X offset, in pixels, from the chosen corner. |
| InpCornerY | 20 | Panel Y offset, in pixels, from the chosen corner. |
Recommended use
- Account-level by nature — the numbers are the same wherever you attach it, so one chart is enough; it doesn't need to run per-symbol.
- With InpResetPeakDaily off (the default), the tracked peak only ever resets when the indicator is removed and re-attached — that's deliberate, since a daily reset would understate your real drawdown from the account's actual high-water mark. Turn it on only if you specifically want a per-day reading.
- Places no orders and holds no position itself — pure read-only reporting, so it carries none of its own risk and works identically on any account type.
- The tracked peak starts from whatever equity is when the indicator is first attached, not your account's all-time high — if you want a true all-time drawdown figure, attach it as early as possible and avoid removing it.
- Works the same on a demo or live account; the number is only as meaningful as the account it's reading from.
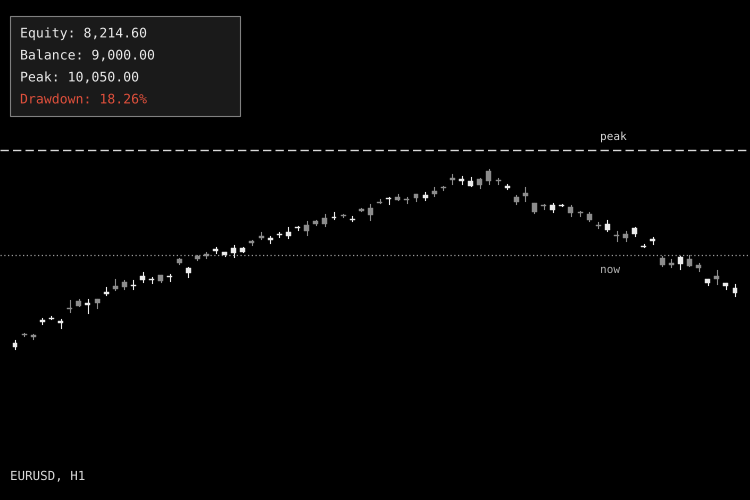
Fig. 1. Equity/Drawdown Monitor Panel on a chart mid-drawdown (shown in black & white per Code Base image guidelines; the panel shows red on a live chart past the threshold).
 Spread and Slippage Tracker
Live spread stats plus real fill-vs-requested slippage logging, account-wide — because "my broker widens spreads at news time" and "my fills are always bad" deserve numbers, not a feeling.
Smart Liquidity Hunter — Confirmed Swing Sweeps for MT5
Closed-bar sweeps of confirmed swing levels, with wick, volatility and freshness filters, liquidity lines, a dashboard and optional alerts.
Golden Cross Trend Filter (50/200 SMA on daily closes)
Classic 50/200-day Golden Cross trend filter: long while the fast SMA of daily closes is above the slow SMA, flat (or optionally short) otherwise. One decision per completed D1 bar, sizing by % of balance or fixed lot.
Support/Resistance and Fair Value Gap Zones
Draws support and resistance levels from confirmed swing highs and lows, and the fair value gaps (3-candle gaps) that price has not filled yet. Rule-based, merges nearby levels by ATR, removes a gap as soon as price trades back through it.