 MetaTrader 5
 Experts
 Indicateurs
 Scripts
 Bibliothèque
 Stockage
Voir comment télécharger gratuitement des robots de trading
Retrouvez-nous sur Facebook !
Rejoignez notre page de fans
Rejoignez notre page de fans
Vous avez aimé le script ? Essayez-le dans le terminal MetaTrader 5

Smart Liquidity Hunter — Confirmed Swing Sweeps for MT5 - indicateur pour MetaTrader 5
fxliner

Forex Trader | MetaTrader Tools & Broker Research
Forex trader based in Indonesia, with a focus on price action, market structure and disciplined risk management. I take a structured approach to chart analysis, position sizing and reviewing trading decisions.
Forex trader based in Indonesia, with a focus on price action, market structure and disciplined risk management. I take a structured approach to chart analysis, position sizing and reviewing trading decisions.
- Vues:
- 264
- Note:
- Publié:
- Mise à jour:
-
 Vous manquez des opportunités de trading :
- Applications de trading gratuites
- Plus de 8 000 signaux à copier
- Actualités économiques pour explorer les marchés financiers
Inscription Se connecterVous acceptez la politique du site Web et les conditions d'utilisation
Si vous n'avez pas de compte, veuillez vous inscrire -
 Besoin d'un robot ou d'un indicateur basé sur ce code ? Commandez-le sur Freelance
Aller sur Freelance
Overview
Smart Liquidity Hunter v1.11 is a MetaTrader 5 indicator for identifying price sweeps around previously confirmed swing highs and lows. It uses OHLC prices as a liquidity proxy: it does not read actual resting orders or stop-loss locations, and it does not execute trades.
Signal rules
A bullish signal requires a closed candle to sweep below an eligible swing low and close back above it. A bearish signal requires a sweep above an eligible swing high followed by a close back below it.
The penetration must exceed the larger of the fixed points threshold and the volatility threshold. Volatility is calculated as the simple mean of true ranges from candles preceding the signal candle. The configured wick, closing-position, freshness and optional candle-direction filters must also pass.
Only swings already confirmed before the signal candle are eligible. A candle qualifying in both directions is skipped. The unfinished candle does not receive a signal arrow.
Inputs and defaults
- SwingStrength = 3: Candles required on each side of a swing point.
- MaxSwingAge = 100: Maximum distance in bars from the signal candle to an eligible swing.
- MaxBarsToScan = 1000: Maximum number of closed historical candles calculated.
- MinSweepPoints = 12: Fixed sweep threshold in symbol points.
- VolatilityPeriod = 14: Lookback for the simple mean of preceding true ranges.
- MinSweepVolRatio = 0.10: Mean true range multiplier for the volatility-based sweep threshold.
- MinWickPercent = 25.0: Minimum rejection wick as a percentage of candle range: lower wick for bullish setups, upper wick for bearish setups.
- MinCloseLocationPct = 60.0: Minimum closing position measured from the low for bullish setups and from the high for bearish setups. At the default 60, bullish closes must lie within the upper 40% of the range and bearish closes within the lower 40%.
- RequireFreshLevel = true: Exclude levels previously pierced by an intervening candle.
- RequireCandleColor = false: When enabled, require close above open for bullish setups and close below open for bearish setups.
- ShowLiquidityLevels = true: Display eligible swing-high and swing-low levels.
- ShowDashboard = true: Display the chart information panel.
- ArrowPaddingPoints = 8: Minimum arrow offset from the candle high or low, in symbol points.
- ArrowOffsetVolRatio = 0.18: Mean true range multiplier for arrow spacing. The greater of this offset and ArrowPaddingPoints is used.
- DashboardInstanceId = A: Identifier of 1-40 characters. Each indicator instance on the same chart must use a different ID.
- DashboardTextColor = clrDodgerBlue: Dashboard text color.
- AlertPopup = false: Enable popup alerts for new closed-bar signals.
- AlertSound = false: Play alert.wav for new closed-bar signals.
- AlertPush = false: Enable push alerts; configure the terminal notification settings before use.
- DashboardX = 15: Dashboard distance from the chart's left edge, in pixels.
- DashboardY = 30: Dashboard distance from the chart's top edge, in pixels.
Chart examples
Green arrows mark bullish sweeps below the qualifying closed candle. Red arrows mark bearish sweeps above the qualifying closed candle. Dotted lines show eligible swing-high and swing-low levels.
The dashboard shows the latest eligible levels and most recent signal in the scanned history. A historical screenshot may therefore show an earlier signal than the dashboard's last-signal timestamp.
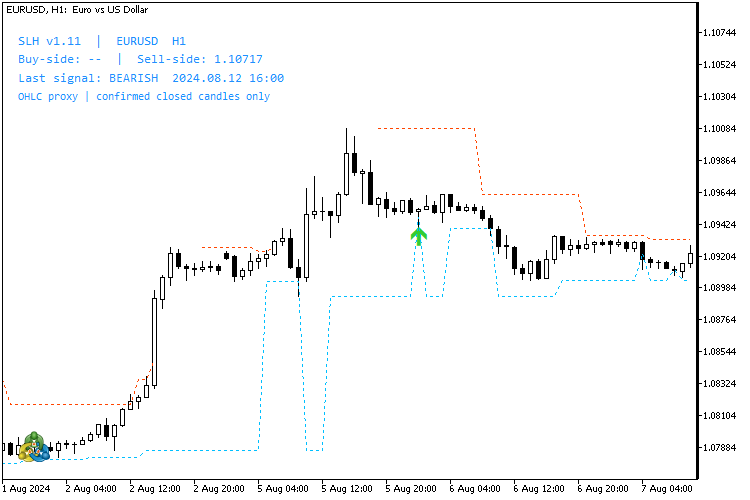
Figure 1. MT5, EURUSD H1: a historical bullish sweep signal.
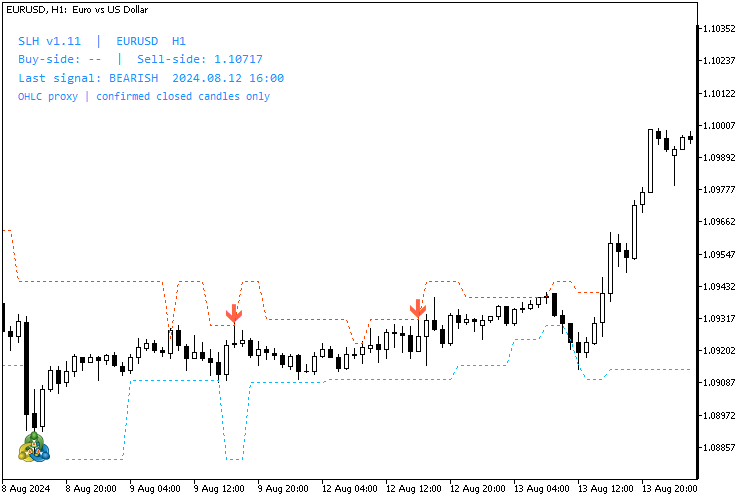
Figure 2. MT5, EURUSD H1: a historical bearish sweep signal.
Usage notes
Start with the default inputs. Swing confirmation requires subsequent candles, so a swing is not available immediately when its high or low forms. Historical output depends on inputs, available price history and the calculation window.
Alerts are disabled by default. Initial attachment, history resets and catch-up batches do not trigger historical alerts. For multiple instances, use distinct DashboardInstanceId values, such as A and B, and different DashboardY positions.
User guide
For installation steps, detailed settings, chart examples and troubleshooting, see the Smart Liquidity Hunter user guide for MT4 and MT5.
Version 1.11
Dashboard object names now remain stable across profile reloads, preventing duplicate labels. Signal calculations are unchanged. A marked sweep does not establish that a reversal will follow.
 MZ Smart Trail Manager - Break-even, Stepped Trailing Stop and Profit Lock
Trade manager for MT5: break-even, stepped trailing stop and progressive profit lock. Works with manual trades or any EA. Distances in ATR, so it fits any symbol. Bilingual panel (EN/AR).
Daily Open Line with Distance in Points
Draws the daily open price as a horizontal line and shows, in points, how far the current price is from today's open. The label changes color depending on whether the price is above or below the open.
Spread and Slippage Tracker
Live spread stats plus real fill-vs-requested slippage logging, account-wide — because "my broker widens spreads at news time" and "my fills are always bad" deserve numbers, not a feeling.
Equity/Drawdown Monitor Panel
A live account-level readout — equity, balance, tracked peak, and current drawdown % from that peak — the one risk number most charts never show you.