 MetaTrader 5
 Experts
 Indicateurs
 Scripts
 Bibliothèque
 Stockage
Voir comment télécharger gratuitement des robots de trading
Retrouvez-nous sur Telegram !
Rejoignez notre page de fans
Rejoignez notre page de fans
Vous avez aimé le script ? Essayez-le dans le terminal MetaTrader 5

Golden Cross Trend Filter (50/200 SMA on daily closes) - expert pour MetaTrader 5
Saad Ferdi

MQL5 and Python developer focused on gold and forex.
I build and fix MT5 Expert Advisors and indicators, with clean source code and clear input settings.
I build and fix MT5 Expert Advisors and indicators, with clean source code and clear input settings.
- Vues:
- 97
- Publié:
-
 Vous manquez des opportunités de trading :
- Applications de trading gratuites
- Plus de 8 000 signaux à copier
- Actualités économiques pour explorer les marchés financiers
Inscription Se connecterVous acceptez la politique du site Web et les conditions d'utilisation
Si vous n'avez pas de compte, veuillez vous inscrire -
 Besoin d'un robot ou d'un indicateur basé sur ce code ? Commandez-le sur Freelance
Aller sur Freelance
The Golden Cross is one of the best-known trend rules: stay in the market while the 50-day simple moving average of daily closes is above the 200-day average, and step aside when it is below (the "death cross"). This Expert Advisor implements exactly that rule, so it can be tested and run on any symbol with daily history.
How it works. The averages are always taken from the last completed daily bar (shift 1), never from the bar that is still forming, so a decision cannot change during the day and there is no look-ahead in the Strategy Tester. Once per new D1 bar the EA compares the two averages: if SMA(fast) > SMA(slow) it wants to be long, otherwise flat; with InpAllowShort enabled it goes short while SMA(fast) < SMA(slow). There is no stop-loss and no take-profit, because the rule itself is the exit.
Session handling. On many CFDs the new daily bar opens while the market is still closed (for example index CFDs at midnight server time). The EA therefore checks the symbol's trade sessions and, if the market is closed or an order is rejected, retries on the next ticks of the same day. Attach it to an H1 (or lower) chart; in the tester use H1 with "Open prices only" or "Every tick", because a D1 chart in "Open prices only" mode receives a single tick at midnight.
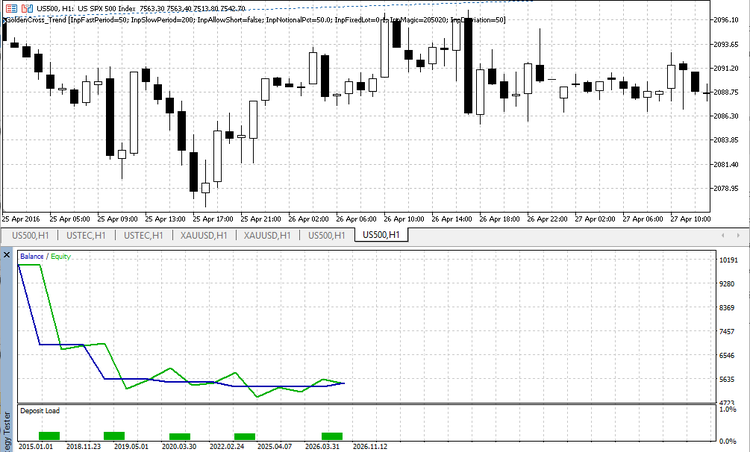
Test on a US500 CFD: the rule worked, the financing did not
US500 CFD, H1, January 2015 to November 2026, 10,000 USD, 50% notional, long only. The EA entered and exited on the same dates as the well-known golden and death crosses of the S&P 500 (April 2016, December 2018, March 2019, March 2020, July 2020, March 2022, January 2023, April 2025, July 2025). The price movement of these trades earned money, but the long positions were held for up to 954 days and the daily swap cost more than twice the price gain:
| Trade | Days held | Price profit | Swap | Net |
|---|---|---|---|---|
| 2016.04 – 2018.12, 2.3 lots | 954 | +1,389.84 | −4,472.90 | −3,083.06 |
| 2019.03 – 2020.03, 1.2 lots | 367 | −403.32 | −898.62 | −1,301.94 |
| 2020.07 – 2022.03, 0.8 lots | 609 | +884.72 | −992.67 | −107.95 |
| 2023.01 – 2025.04, 0.6 lots | 805 | +813.80 | −983.25 | −169.45 |
| 2025.07 – 2026.11, 0.4 lots | 499 | +561.16 | −408.47 | +152.69 |
| Total | +3,246.20 | −7,755.91 | −4,509.71 |
Two notes on this test. First, the swap was a constant 2.04 USD per lot per day in every trade: the Strategy Tester applies the symbol's current swap to the whole history, so in the early years, when the index was near 2,100 instead of 7,500, the cost is overstated relative to the position value. Second, even at today's price that swap is close to 10% per year of the position value, which is enough to remove most of the return of a slow trend rule. On the S&P 500 price index itself (1993–2026, no costs) the same rule earned a CAGR of 8.41% against 8.93% for buy and hold, with a maximum drawdown of −33.9% instead of −56.8%. The difference between the two results is the cost of holding a CFD for months. Check the swap of your symbol before using a long-holding EA.
Inputs
- InpFastPeriod (50) – fast SMA period, in daily bars.
- InpSlowPeriod (200) – slow SMA period, in daily bars; must be greater than the fast period.
- InpAllowShort (false) – also hold a short position while the fast SMA is below the slow SMA.
- InpNotionalPct (50) – position value as a percentage of the account balance; set 0 to use the fixed lot instead.
- InpFixedLot (0.10) – lot used when InpNotionalPct = 0.
- InpMagic – magic number, so the EA manages only its own positions.
- InpDeviation (50) – maximum slippage in points.
Historical results for this exact rule and symbol. They do not guarantee future results.
 Equity/Drawdown Monitor Panel
A live account-level readout — equity, balance, tracked peak, and current drawdown % from that peak — the one risk number most charts never show you.
Spread and Slippage Tracker
Live spread stats plus real fill-vs-requested slippage logging, account-wide — because "my broker widens spreads at news time" and "my fills are always bad" deserve numbers, not a feeling.
Support/Resistance and Fair Value Gap Zones
Draws support and resistance levels from confirmed swing highs and lows, and the fair value gaps (3-candle gaps) that price has not filled yet. Rule-based, merges nearby levels by ATR, removes a gap as soon as price trades back through it.
Multi-Timeframe Trend Dashboard
A compact dashboard that classifies EMA trends across multiple timeframes and displays slope, ATR distance, duration and an alignment summary.