 MetaTrader 5
 Experts
 Indicateurs
 Scripts
 Bibliothèque
 Stockage
Rejoignez notre page de fans

Candle Body-to-Wick Pressure Oscillator - indicateur pour MetaTrader 5

- Vues:
- 1436
- Note:
- Publié:
- Mise à jour:
-
 Vous manquez des opportunités de trading :
- Applications de trading gratuites
- Plus de 8 000 signaux à copier
- Actualités économiques pour explorer les marchés financiers
Inscription Se connecterVous acceptez la politique du site Web et les conditions d'utilisation
Si vous n'avez pas de compte, veuillez vous inscrire -
 Besoin d'un robot ou d'un indicateur basé sur ce code ? Commandez-le sur Freelance
Aller sur Freelance
Besoin d'un robot ou d'un indicateur basé sur ce code ? Commandez-le sur Freelance
Aller sur Freelance
Candle Body-to-Wick Pressure Oscillator
Short Description: Converts the body-to-wick makeup of every candle into a bounded conviction reading, then smooths it into an oscillator that flags buyer/seller pressure and automatically marks divergence against price.
Author: Samuel Ojo
The idea behind it
Most momentum oscillators work off closing price alone and throw away the shape of the candle that produced it. A candle with a huge upper wick and a tiny body closing green tells a very different story than a candle that closes green on a full-bodied range expansion, yet a standard RSI or MACD reads them almost identically. This indicator starts from the candle geometry itself. For every bar it computes a body ratio (the absolute body size divided by the full high-low range) and signs it by the direction of the candle. It then computes a wick imbalance term — the lower wick minus the upper wick, also scaled by range — which captures rejection: a long lower wick implies buyers stepped in and pushed price back up from the lows, a long upper wick implies the opposite. These two components are combined and averaged into a single normalized score per bar, bounded to roughly ±1.
That raw per-bar score is then averaged over InpOscPeriod bars and scaled to a ±100 range to produce the main oscillator line, plotted as a two-tone histogram in a separate subwindow. A signal line — an exponential moving average of the oscillator — is layered on top the same way a MACD signal line works. Because the calculation is purely geometric (no external reference series, no volume dependency), it behaves consistently across symbols and timeframes. It works on any instrument and any chart, but reads cleanest on liquid pairs like EURUSD viewed on the M15 to H4 range, where candle bodies and wicks are less noisy than on very low timeframes.
How to interpret it
- Pressure histogram — the main oscillator plot. Bars above zero (lighter shade) mean bullish body/wick conviction dominates the lookback window; bars below zero (darker shade) mean sellers are in control. The further the reading sits from zero, the more one-sided the recent candle geometry has been.
- Body ratio and wick imbalance calculation — each bar's contribution is direction × bodyRatio + wickWeight × wickImbalance , divided by (1 + wickWeight) to keep the raw score inside a consistent band before it is averaged into the oscillator. InpWickWeight controls how much rejection wicks matter relative to raw body size.
- Signal line crosses and zero line — a cross of the oscillator above its signal line while both sit above zero reinforces an active bullish phase; the same cross below zero reinforces a bearish phase. Crosses through the zero line itself mark a shift in which side currently controls candle structure.
- Divergence arrows — the indicator scans confirmed price pivots (using InpFractalRange bars on each side) within the last InpDivergenceLookback bars. A green up-arrow marks bullish divergence when price prints a lower low but the oscillator prints a higher low at the matching pivot; a red down-arrow marks bearish divergence when price prints a higher high while the oscillator prints a lower high. These flag fading conviction ahead of a possible reversal.
External variables (inputs)
| Input | Default | Purpose |
|---|---|---|
| InpOscPeriod | 14 | Averaging period applied to the per-bar raw pressure score to form the oscillator line. |
| InpSignalPeriod | 9 | EMA period used to smooth the oscillator into the signal line. |
| InpWickWeight | 1.0 | Weight applied to the wick-imbalance component relative to body strength when computing each bar's raw score. |
| InpFractalRange | 2 | Number of bars required on each side of a bar to confirm it as a price pivot high/low for divergence detection. |
| InpDivergenceLookback | 50 | Number of recent bars scanned when searching for the pivot pairs used in divergence detection. |
| InpShowDivergence | true | Enables or disables the bullish/bearish divergence arrows on the oscillator subwindow. |
Recommended use
Add the indicator to its own subwindow below a clean candlestick chart with no other overlays competing for attention, since its entire premise is reading candle geometry directly. On trending instruments, use the ±60 dotted levels as conviction thresholds — readings pushing past them alongside a signal-line cross in the same direction favor trend-following entries, while readings that stall near zero or repeatedly fail to reach ±60 suggest a choppy, low-conviction phase best avoided. Divergence arrows work best as a warning to tighten stops or take partial profit on an existing position rather than as a standalone reversal trigger; combine them with a structural confirmation such as a broken trendline or a failed retest before treating them as an entry signal on their own. Because the oscillator is scale-independent, the same input defaults transfer reasonably well between forex majors, indices, and commodities — only the divergence lookback tends to need adjustment for markedly slower or faster instruments.
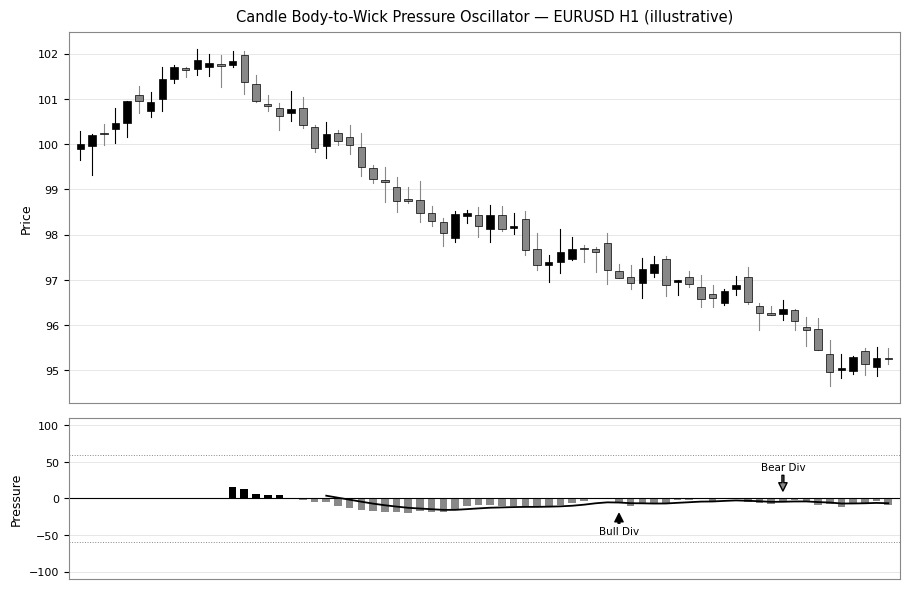
Fig. 1. Price chart with the Body-to-Wick Pressure Oscillator in the subwindow below — the two-tone histogram reflects bullish/bearish candle conviction, the solid line is the EMA signal, and the arrows mark confirmed bullish and bearish divergence against price.
Multi-Symbol Correlation Divergence Meter
Tracks the rolling correlation between the current chart symbol and a chosen reference symbol, and flags the moment they decouple while their price spread is statistically stretched.
Adaptive Volume Profile Node Tracker
Builds a rolling, volatility-adaptive volume profile over a configurable lookback window and plots the Point of Control (POC), Value Area High/Low, and statistically significant High/Low Volume Nodes (HVN/LVN) directly on the chart.
Currency Strength Meter
Ranks the 8 major currencies by relative strength on a live on-chart panel, calculated from the average percentage change of every available cross pair — not just USD pairs — so weak/strong currencies are visible at a glance, independent of whichever chart you have open.
 Server Clock and Daily Reset Hour
A free, read-only MetaTrader 5 panel that converts your prop firm's daily reset rule (written in whatever time zone the firm uses) into your broker's actual server time, shows a live countdown to the next reset, and warns you before a daylight-saving shift moves the boundary by an hour. Sends no orders, reads no account data, display only.