 MetaTrader 5
 Experts
 Indicateurs
 Scripts
 Bibliothèque
 Stockage
Rejoignez notre page de fans

Adaptive Volume Profile Node Tracker - indicateur pour MetaTrader 5

- Vues:
- 100
- Note:
- Publié:
-
 Vous manquez des opportunités de trading :
- Applications de trading gratuites
- Plus de 8 000 signaux à copier
- Actualités économiques pour explorer les marchés financiers
Inscription Se connecterVous acceptez la politique du site Web et les conditions d'utilisation
Si vous n'avez pas de compte, veuillez vous inscrire -
 Besoin d'un robot ou d'un indicateur basé sur ce code ? Commandez-le sur Freelance
Aller sur Freelance
Besoin d'un robot ou d'un indicateur basé sur ce code ? Commandez-le sur Freelance
Aller sur Freelance
Suiveur adaptatif de nœuds à profil volumique
Auteur : Adeolu Gbadebo
Le principe
La plupart des outils de profil de volume disponibles sur la plateforme recalculent leurs intervalles à partir d’une session fixe ou d’une période calendaire fixe, ce qui signifie que la résolution du profil reste la même, que le marché évolue latéralement dans une fourchette de 10 pips ou qu’il enregistre des fluctuations de 100 pips par heure. Cet indicateur fonctionne différemment : il lie la largeur des intervalles à la volatilité actuelle. À chaque reconstruction du profil, celui-ci lit la valeur actuelle de l’ATR (InpATRPeriod) et utilise une fraction de celle-ci comme hauteur de base des tranches, puis limite le nombre de tranches résultant entre 5 et InpMaxBins. Dans une fourchette calme, les intervalles sont étroits et nombreux, ce qui permet de cerner avec précision les zones où la liquidité s’est concentrée. Sur un marché en expansion et volatil, les intervalles s’élargissent automatiquement, ce qui garantit que le nombre de nœuds reste statistiquement significatif, au lieu de répartir le volume sur des dizaines de tranches quasi vides.
Le profil lui-même est construit à partir des dernières barres InpLookback complétées, en utilisant par défaut le volume par tick (ou le volume réel/de bourse si votre courtier le fournit et que l’option InpUseRealVolume est activée). Le volume de chaque barre est réparti, en fonction de son cours de clôture, dans le bin auquel il correspond. À partir de là, l’indicateur localise le « Point de contrôle » (le compartiment unique contenant le plus grand volume), s'étend vers l’extérieur, tranche par tranche, pour englober InpValueAreaPercent du volume total correspondant aux plus hauts et plus bas de la zone de valeur, et marque les tranches situées à plus de InpNodeStdDevMult écarts-types au-dessus de la moyenne comme des nœuds à fort volume, et celles situées bien en dessous de la moyenne comme des nœuds à faible volume. L’ensemble du profil est recalculé de manière glissante toutes les InpRecalcBars barres, de sorte que les niveaux reflètent véritablement la structure actuelle du marché plutôt qu’un niveau établi une seule fois au début d’une séance. Recommandé pour l'EURUSD et d'autres paires de devises liquides sur les graphiques M15 à H1, où une période de rétrospective de 150 à 300 barres couvre plusieurs heures, voire quelques jours, de flux d'ordres réel.
Comment l’interpréter
- Ligne POC (bleu continu) — niveau de prix où le volume le plus important a été négocié au cours de la période de référence. Elle agit comme un aimant : un prix qui s'en éloigne, en l'absence d'un facteur de tendance puissant, a tendance à revenir vers elle au fil du temps.
- Haut et bas de la zone de valeur (lignes pointillées argentées) — ensemble, ils délimitent la zone contenant InpValueAreaPercent de l’ensemble du volume négocié. Un cours situé à l’intérieur de cette bande est considéré comme étant à sa « juste valeur » ; un cours qui clôture et se maintient en dehors de la bande est considéré comme surévalué et plus susceptible d’attirer une participation directionnelle, suivant la tendance.
- Nœuds à fort volume (ligne épaisse orange-rouge) — intervalles où la liquidité s’est accumulée bien au-delà de la moyenne statistique. Ceux-ci agissent souvent comme des niveaux de support ou de résistance, car un grand nombre d’ordres en attente et d’exécutions antérieures se trouvent à ce prix.
- Nœuds à faible volume (grise en pointillés fins) — fourchettes que le marché a traversées rapidement sans accumulation de volume. Le cours a tendance à traverser ces zones rapidement, ce qui les rend utiles comme niveaux de confirmation d’accélération ou de cassure, ainsi que comme repères logiques pour le placement des stops.
- Conseil pratique: prenez le contre-pied des retours vers le point de contrôle (POC) lorsque le cours se trouve en dehors de la zone de valeur et que la dynamique est faible, ou utilisez une cassure nette d’un nœud à faible volume (LVN) accompagnée d’une expansion comme signal de poursuite de la tendance vers le prochain niveau de nœud à fort volume (HVN).
Variables externes (données d’entrée)
| Entrée | Par défaut | Objectif |
|---|---|---|
| InpLookback | 200 | Nombre de barres terminées dans la fenêtre glissante utilisée pour établir le profil de volume. |
| InpMaxBins | 24 | Limite supérieure du nombre de tranches de prix dans lesquelles le profil peut être divisé. |
| InpATRPeriod | 14 | Période ATR utilisée pour adapter la largeur des tranches au régime de volatilité actuel. |
| InpValueAreaPercent | 70,0 | Pourcentage du volume total de la fenêtre compris entre les limites supérieure et inférieure de la zone de valeur. |
| InpRecalcBars | 10 | Fréquence (en barres) à laquelle le profil glissant est recalculé et les niveaux mis à jour. |
| InpUseRealVolume | false | Utiliser le volume réel/de marché à la place du volume par tick lorsque le flux de données le prend en charge. |
| InpNodeStdDevMult | 1,0 | Multiplicateur de l'écart-type qui définit la sensibilité de la classification HVN / LVN. |
| InpHVNColor | clrOrangeRed | Couleur de la ligne utilisée pour marquer les nœuds à haut volume. |
| InpLVNColor | clrGray | Couleur de la ligne utilisée pour marquer les nœuds à faible volume. |
Utilisation recommandée
Appliquez l’indicateur à une paire de devises liquide sur la période M15 ou H1 et conservez les paramètres par défaut pendant les premières sessions afin de vous familiariser avec la manière dont le profil évolue. Les traders adoptant une approche de retour à la moyenne trouveront le plus d’intérêt à parier sur un retour du cours vers le POC (point de contrôle) une fois que celui-ci a clôturé en dehors de la zone de valeur (Value Area) sur un élan baissier. Les traders de cassure doivent surveiller les clôtures au-delà d’un nœud à faible volume, accompagnées d’un élargissement de la fourchette et d’une hausse du volume de ticks, car ces zones offrent la moindre résistance à la poursuite du mouvement. Cet outil s’associe bien à un simple filtre de tendance ou à un oscillateur de momentum dans une sous-fenêtre : utilisez cet outil secondaire pour confirmer la direction, et servez-vous des niveaux du profil pour synchroniser vos entrées et placer vos stops juste au-delà du nœud le plus proche plutôt qu’à une distance arbitraire.
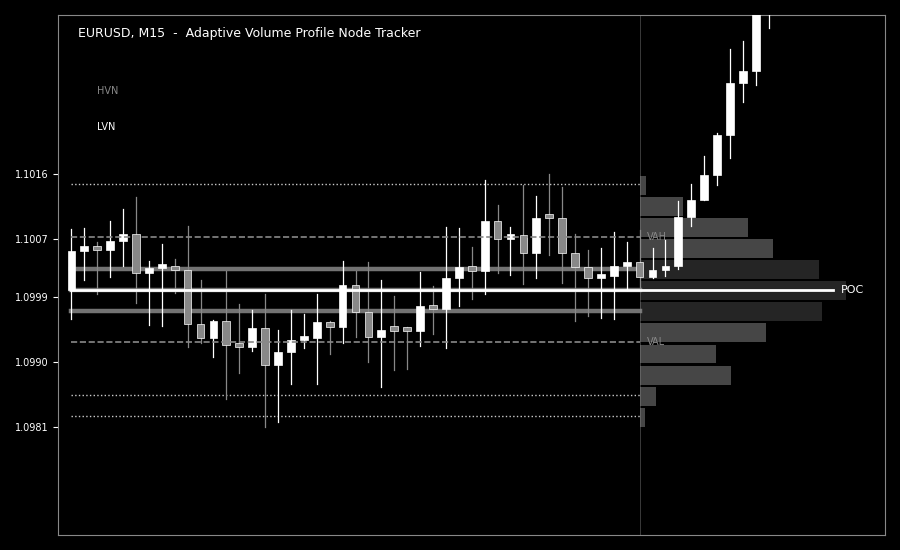
Fig. 1. Profil de volume glissant sur l'EURUSD, M15. La ligne continue marque le Point de Contrôle, les lignes pointillées encadrent les extrêmes de la Zone de Valeur, les nœuds épais indiquent les nœuds à fort volume, les nœuds en pointillés indiquent les nœuds à faible volume, et les barres ombrées à droite forment le mini-histogramme de profil construit à partir de la fenêtre de rétrospective.
Traduit de l’anglais par MetaQuotes Ltd.
Code original : https://www.mql5.com/en/code/76264
Multi-Symbol Correlation Divergence Meter
Suivi de la corrélation glissante entre le symbole du graphique actuel et un symbole de référence choisi, et signalement du moment où ils se découplent alors que leur écart de cours est statistiquement étendu.
Stop Geometry Visualizer MT5
Indicateur MT5 en lecture seule qui affiche sur le graphique les niveaux de stop et de gel définis par le courtier.
 EdgeMeter - does your entry signal beat the spread?
Évalue si un signal d'entrée permet réellement de dégager un bénéfice supérieur aux coûts de transaction, avant que vous ne passiez des semaines à développer un EA autour de celui-ci. Fournit le résultat net après déduction des coûts, une statistique t fiable sur des échantillons non chevauchants et un contrôle aléatoire. Ne passe aucun ordre.
Dynamic Session Range Sweep Detector with Liquidity Zone Marking
Il suit les fourchettes de séance des marchés asiatiques, londoniens et new-yorkais, verrouille chacune d’entre elles à la clôture de la séance et signale les véritables « liquidité sweeps » — une mèche qui perce un plus haut ou un plus bas verrouillé et clôture à nouveau à l’intérieur de celui-ci — à l’aide d’une flèche et d’une zone de réaction ombrée. Il ne se redessine pas et fonctionne sur n’importe quel symbole et n’importe quelle période.