 MetaTrader 5
 Experts
 Indicateurs
 Scripts
 Bibliothèque
 Stockage
Rejoignez notre page de fans

Multi-Symbol Correlation Divergence Meter - indicateur pour MetaTrader 5

- Vues:
- 43
- Note:
- Publié:
-
 Vous manquez des opportunités de trading :
- Applications de trading gratuites
- Plus de 8 000 signaux à copier
- Actualités économiques pour explorer les marchés financiers
Inscription Se connecterVous acceptez la politique du site Web et les conditions d'utilisation
Si vous n'avez pas de compte, veuillez vous inscrire -
 Besoin d'un robot ou d'un indicateur basé sur ce code ? Commandez-le sur Freelance
Aller sur Freelance
Besoin d'un robot ou d'un indicateur basé sur ce code ? Commandez-le sur Freelance
Aller sur Freelance
Appareil de mesure de la divergence de corrélation multisymbole
Auteur : Adeolu Gbadebo
Le principe
La plupart des paires et des instruments évoluent de concert pendant de longues périodes. L'EURUSD suit le GBPUSD, l'or suit l'argent, un indice suit l'action qui lui confère la plus forte pondération. C'est sur cette relation que reposent discrètement bon nombre de stratégies de couverture, de paniers et de trading de paires — et elle n'est pas constante. Elle se resserre lors des séances calmes et se rompt à l’occasion d’actualités, de ruptures de liquidité ou d’une divergence entre les facteurs sous-jacents des deux instruments. Cet indicateur quantifie cette relation au lieu de la laisser à l’appréciation visuelle de deux graphiques placés côte à côte.
Il calcule une corrélation de Pearson glissante entre les rendements barre par barre du symbole actuel et d’un symbole de référence que vous spécifiez dans les paramètres, sur une période rétrospective configurable. Parallèlement, il suit l’écart logarithmique de prix entre les deux instruments — c’est-à-dire essentiellement l’écart relatif entre le symbole actuel et la référence — et convertit cet écart en un z-score glissant. Une « rupture de divergence » n’est signalée que lorsque les deux conditions sont réunies : la corrélation est tombée en dessous de votre seuil de découplage et le z-score de l’écart a dépassé une valeur extrême, combinaison qui tend à précéder soit un retour brutal à la normale, soit le début d’un régime véritablement nouveau entre les deux instruments.
Utilisez-le sur n’importe quel symbole disposant d’une contrepartie liquide et corrélée — l’EURUSD par rapport au GBPUSD, une paire de métaux par rapport au DXY, ou deux CFD sur indices corrélés. Conçu comme un indicateur à fenêtre séparée, il s’affiche sous le cours plutôt que par-dessus, ce qui permet de garder le graphique clair et lisible.
Comment l’interpréter
- Ligne de corrélation — la corrélation de Pearson glissante entre les rendements des deux instruments, comprise entre -1 et +1. Elle s’affiche en gris clair tant que la paire reste « couplée » (au-dessus du seuil de rupture) et passe au blanc dès que la corrélation passe en dessous de ce seuil, ce qui permet de repérer d’un seul coup d’œil une phase de découplage sans avoir à lire la valeur exacte.
- Histogramme du Z-score de l'écart — Z-score glissant de l'écart logarithmique de cours entre le titre actuel et le titre de référence. Des valeurs proches de zéro indiquent que l'écart se situe près de sa moyenne récente ; des valeurs tendant vers ±2 ou au-delà signifient que le titre actuel s'est éloigné de manière inhabituelle de la référence en termes relatifs.
- Flèches « Divergence à la hausse » / « Divergence à la baisse » — affichées uniquement lorsque la corrélation est découplée et que le Z-Score est extrême en même temps. Une flèche vers le haut indique un extrême de spread négatif (le symbole actuel a pris du retard par rapport à la référence et pourrait être sur le point de rattraper son retard) ; une flèche vers le bas indique un extrême de spread positif (le symbole actuel a pris de l’avance et pourrait être sur le point de céder une partie de ce gain).
- Utilisation pratique — considérez une corrélation élevée et durable comme un feu vert pour des stratégies de valeur relative ou de couverture qui supposent que les deux instruments continuent d’évoluer de concert. Considérez une flèche de divergence comme un signal indiquant soit de réduire le risque sur les positions qui reposent sur la corrélation, soit de rechercher une opportunité de retour à la moyenne à court terme dans la direction suggérée par la flèche, idéalement avec une confirmation par l’évolution des cours ou la dynamique sur le graphique du symbole concerné.
Variables externes (données d’entrée)
| Entrée | Valeur par défaut | Objectif |
|---|---|---|
| InpRefSymbol | « GBPUSD » | Symbole de référence auquel sont comparés les rendements et le spread du graphique actuel. Doit être disponible dans Market Watch. |
| InpCorrPeriod | 50 | Nombre de barres utilisées pour calculer la corrélation de Pearson glissante entre les rendements des deux symboles. |
| InpZPeriod | 50 | Nombre de barres utilisées pour calculer la moyenne et l'écart-type de l'écart logarithmique des cours pour le score z. |
| InpCorrLowThreshold | 0,30 | Niveau de corrélation absolue en dessous duquel les deux symboles sont considérés comme « découplés » et la ligne devient blanche. |
| InpZScoreThreshold | 2,0 | Score z absolu requis, associé à une corrélation « découplée », pour tracer une flèche de divergence. |
| InpArrowsEnabled | true | Active ou désactive les flèches de divergence vers le haut / vers le bas. |
| InpNormalColor | clrSilver | Couleur de la ligne de corrélation tant que la paire reste couplée (au-dessus du seuil de rupture). |
| InpBreakdownColor | clrWhite | Couleur de la ligne de corrélation une fois que la paire se découple (en dessous du seuil de rupture). |
| InpZScoreColor | clrGray | Couleur de l'histogramme pour le graphique du z-score de l'écart. |
Utilisation recommandée
Ajoutez l’indicateur au symbole que vous comptez réellement négocier, puis définissez InpRefSymbol sur l’instrument qu’il suit habituellement — une paire de devises corrélée, une matière première associée ou un indice de référence. Commencez par la période de rétrospection par défaut de 50 barres sur M15 ou H1 ; les périodes plus courtes réagissent plus rapidement mais produisent des fluctuations de corrélation plus bruitées, tandis que les périodes plus longues sont plus stables mais plus lentes à signaler une véritable rupture. Combinez une flèche de divergence avec votre propre analyse de structure ou de momentum sur le symbole concerné avant d'agir : l'indicateur identifie le moment où deux instruments se sont statistiquement écartés, et non lequel des deux a « raison » ; ainsi, un signal de confirmation sur le cours vous évite de parier à contre-courant sur une cassure qui s'avère être le début d'une nouvelle tendance plutôt qu'un simple rebond.
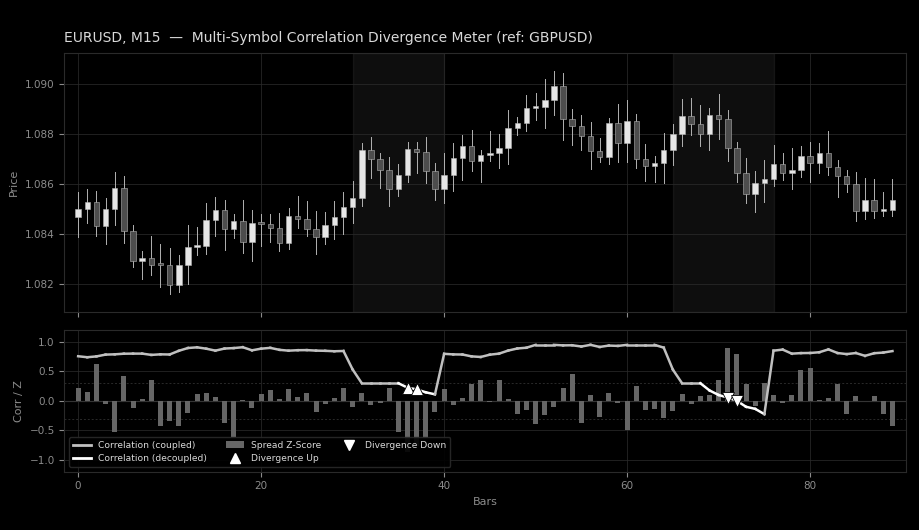
Fig. 1. EURUSD M15 avec le Multi-Symbol Correlation Divergence Meter tracé par rapport à la paire GBPUSD. La ligne de corrélation passe de l'argent au blanc à mesure que la paire se découple, l’histogramme gris montre le z-score de l’écart s’étirant jusqu’à une valeur extrême, et les flèches blanches marquent les événements de rupture de divergence qui en résultent.
Traduit de l’anglais par MetaQuotes Ltd.
Code original : https://www.mql5.com/en/code/76265
Stop Geometry Visualizer MT5
Indicateur MT5 en lecture seule qui affiche sur le graphique les niveaux de stop et de gel définis par le courtier.
 Quantora Spread Monitor MT5 - Professional Live Spread Monitoring Tool
Monitor de spread open source professionnel pour MetaTrader 5. Affiche le spread en temps réel, les valeurs minimales, maximales et moyennes, un graphique historique ainsi que des alertes configurables en cas de spread élevé, le tout via un tableau de bord Quantora moderne.
Adaptive Volume Profile Node Tracker
Crée un profil de volume glissant, s'adaptant à la volatilité, sur une fenêtre rétrospective configurable, et trace le « Point of Control » (POC), les plus hauts et plus bas de la zone de valeur, ainsi que les nœuds de volume haut et bas statistiquement significatifs (HVN/LVN) directement sur le graphique.
 EdgeMeter - does your entry signal beat the spread?
Évalue si un signal d'entrée permet réellement de dégager un bénéfice supérieur aux coûts de transaction, avant que vous ne passiez des semaines à développer un EA autour de celui-ci. Fournit le résultat net après déduction des coûts, une statistique t fiable sur des échantillons non chevauchants et un contrôle aléatoire. Ne passe aucun ordre.