Voir comment télécharger gratuitement des robots de trading
Retrouvez-nous sur Telegram !
Rejoignez notre page de fans
Un script intéressant ?
Poster un lien vers celui-ci -
laisser les autres l'évaluer
Vous avez aimé le script ? Essayez-le dans le terminal MetaTrader 5
Indicateurs

Quantora Trade Statistics Dashboard MT5 - Professional Trading Performance Analytics - indicateur pour MetaTrader 5

Vues:
99
Publié:
MQL5 Freelance Besoin d'un robot ou d'un indicateur basé sur ce code ? Commandez-le sur Freelance Aller sur Freelance
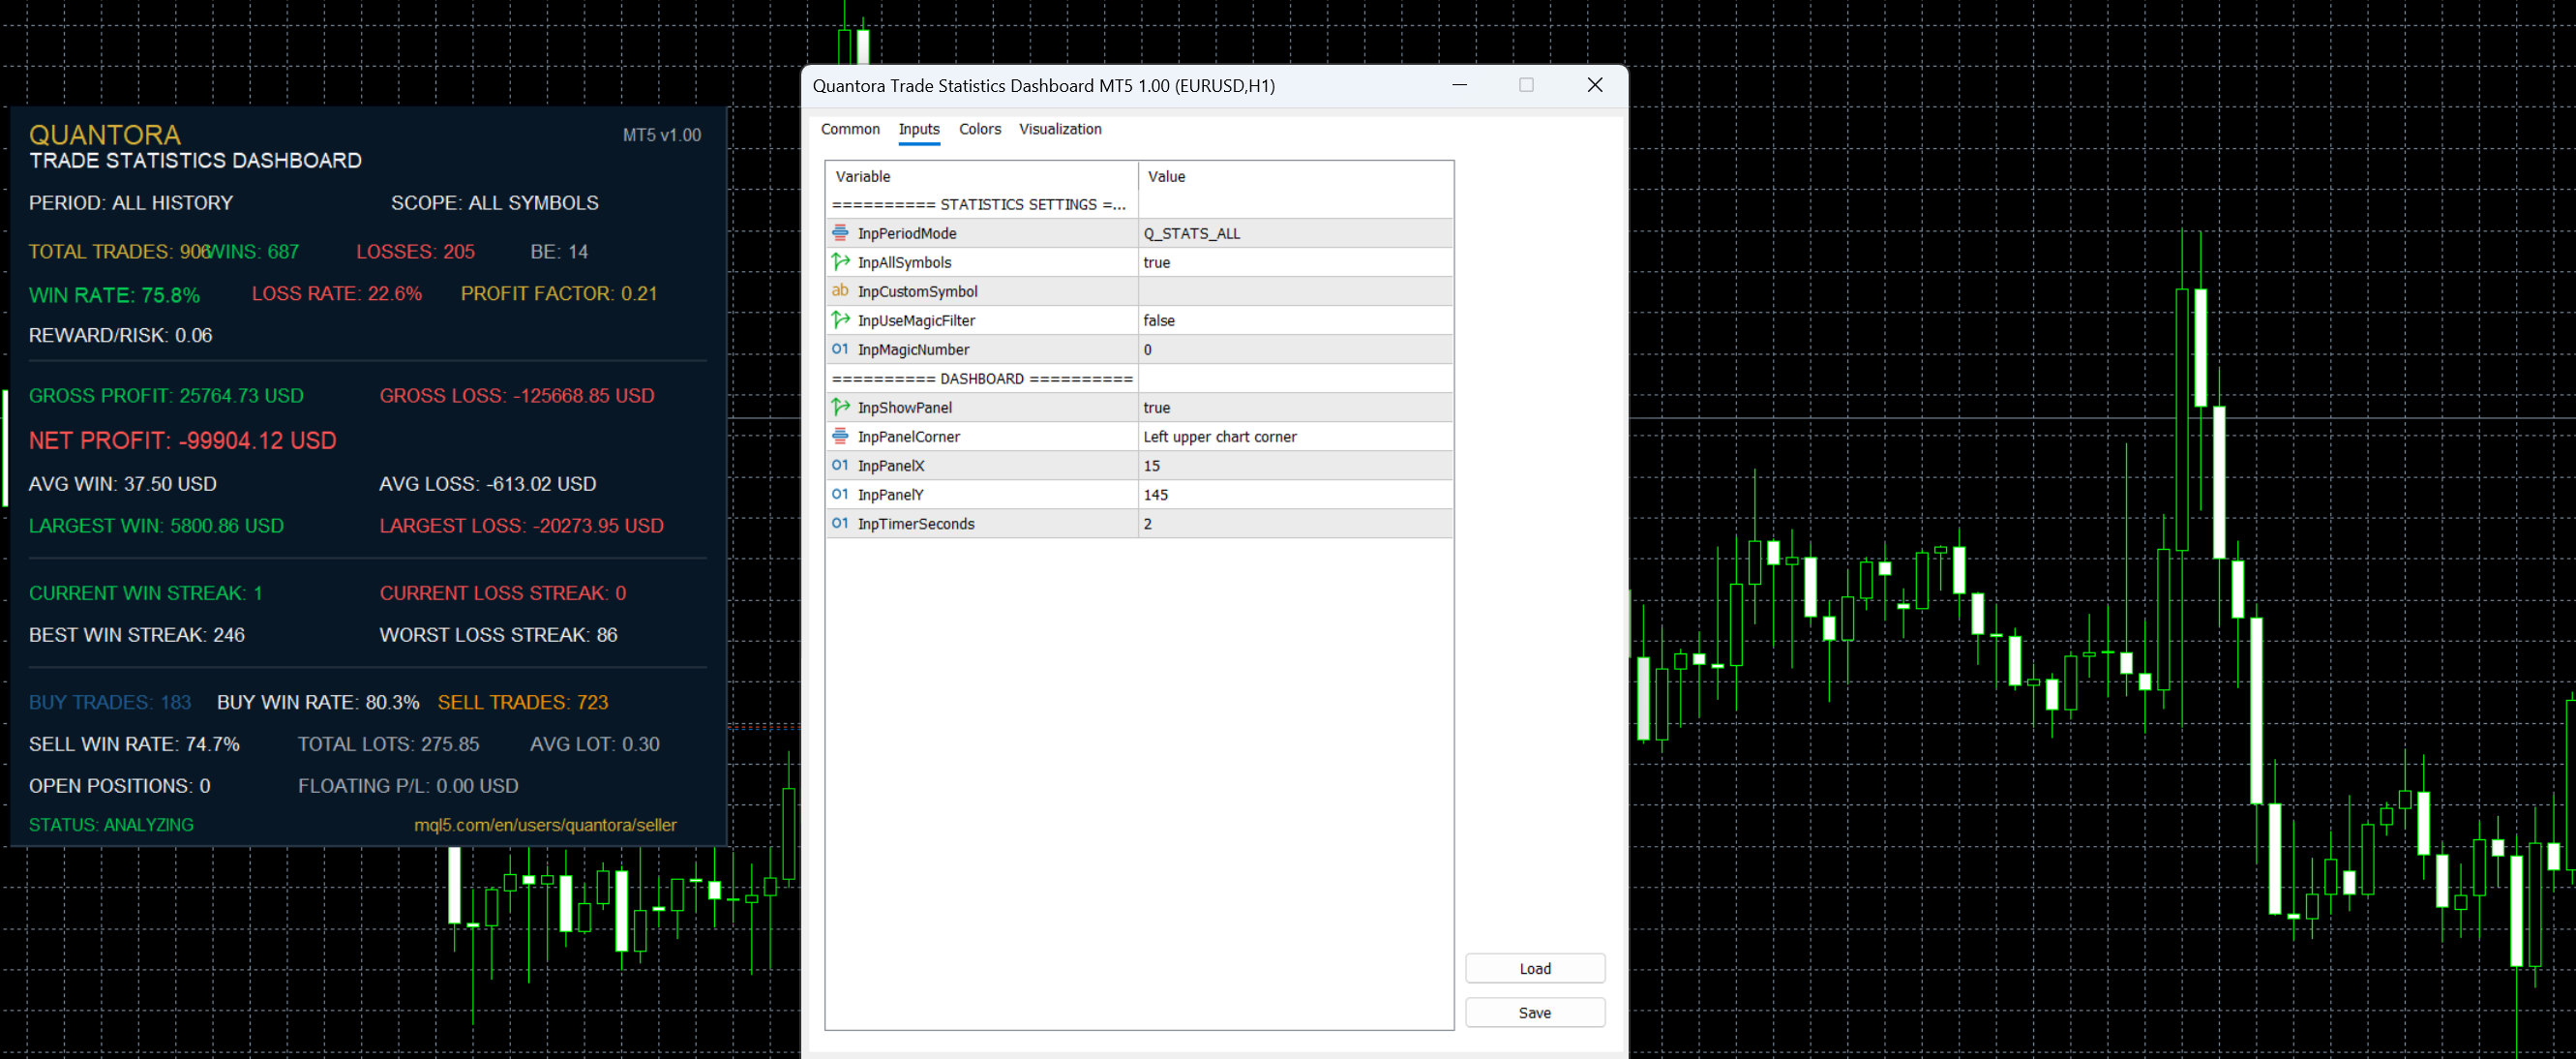

Quantora Trade Statistics Dashboard MT5 is a professional trading performance analytics indicator designed for MetaTrader 5.

The indicator analyzes historical closed trading deals and transforms them into an easy-to-read real-time performance dashboard.

Instead of manually reviewing Account History, traders can quickly monitor important statistics including Win Rate, Profit Factor, Reward/Risk Ratio, Net Profit, Average Win/Loss, Winning and Losing Streaks, BUY/SELL performance and trading volume.

Statistics can be analyzed for:

TODAY — THIS WEEK — THIS MONTH — ALL HISTORY

The dashboard also supports symbol and Magic Number filtering, making it useful for analyzing individual trading strategies or Expert Advisors.

Main Features

  • Total Closed Trades
  • Winning Trades
  • Losing Trades
  • Breakeven Trades
  • Win Rate %
  • Loss Rate %
  • Gross Profit
  • Gross Loss
  • Net Profit
  • Profit Factor
  • Average Win
  • Average Loss
  • Reward / Risk Ratio
  • Largest Winning Trade
  • Largest Losing Trade
  • Current Win Streak
  • Current Loss Streak
  • Best Win Streak
  • Worst Loss Streak
  • BUY Trades
  • SELL Trades
  • BUY Win Rate
  • SELL Win Rate
  • Total Lots Traded
  • Average Lot Size
  • Open Positions
  • Current Floating P/L
  • TODAY statistics
  • THIS WEEK statistics
  • THIS MONTH statistics
  • ALL HISTORY statistics
  • All Symbols mode
  • Custom Symbol filtering
  • Optional Magic Number filtering
  • Automatic dashboard updates
  • Professional Quantora interface
  • Low CPU usage
  • Works on all chart timeframes
  • Free and open-source MQ5 code

Performance Summary

The dashboard provides an immediate overview of historical trading performance.

Example:

                                                    TOTAL CLOSED TRADES       148
WINNING TRADES             94
LOSING TRADES              51
BREAKEVEN TRADES            3

WIN RATE                63.51%
LOSS RATE               34.46%

PROFIT FACTOR             1.84
REWARD / RISK             1.27

This provides a quick way to evaluate the historical results of qualifying closed trading deals.

Profit Analysis

The indicator calculates several important financial performance statistics.

Example:

                                                    GROSS PROFIT        4,825.40 USD
GROSS LOSS         -2,621.80 USD
NET PROFIT          2,203.60 USD

Gross Profit represents the combined result of profitable qualifying deals.

Gross Loss represents the combined result of losing qualifying deals.

Net Profit represents the combined net result after applicable profit, swap, commission and fee values.

Profit Factor

Profit Factor is calculated using:

                                                    Profit Factor =
Gross Profit / Absolute Gross Loss

For example:

                                                    Gross Profit = 4,825.40
Gross Loss   = 2,621.80

Profit Factor = 1.84

When qualifying profitable deals exist but no losing deals are available, the dashboard displays a high/infinite-equivalent Profit Factor condition.

Average Win and Average Loss

The dashboard automatically calculates:

                                                    AVERAGE WIN          51.33 USD
AVERAGE LOSS        -51.41 USD

LARGEST WIN         284.50 USD
LARGEST LOSS       -176.20 USD

These statistics help traders understand the typical size of profitable and losing outcomes in the selected history period.

Reward / Risk Ratio

The displayed historical Reward/Risk Ratio is calculated from:

                                                    Average Winning Deal
÷
Absolute Average Losing Deal

Example:

                                                    Average Win       65.00
Average Loss     -50.00

Reward / Risk      1.30

This represents a historical statistical ratio and is not the predefined Stop Loss / Take Profit risk-reward ratio of individual trades.

Winning and Losing Streaks

Quantora Trade Statistics Dashboard analyzes consecutive trading results.

The dashboard displays:

                                                    CURRENT WIN STREAK       3
CURRENT LOSS STREAK      0

BEST WIN STREAK          8
WORST LOSS STREAK        4

This provides additional information about the consistency of historical trading results.

BUY / SELL Analysis

BUY and SELL results are analyzed separately.

Example:

                                                    BUY TRADES              82
BUY WIN RATE         65.85%

SELL TRADES             66
SELL WIN RATE        60.61%

This can help identify whether qualifying historical results performed differently between BUY and SELL directions.

Trading Volume Statistics

The indicator also analyzes historical trading volume.

Displayed statistics include:

                                                    TOTAL LOTS           14.80
AVERAGE LOT           0.10

Total Lots represents the combined volume of qualifying closed deals in the selected analysis period.

Average Lot represents:

                                                    Total Qualifying Volume
÷
Number of Qualifying Closed Deals

Analysis Periods

Four analysis periods are available.

TODAY

Analyzes qualifying deals from the beginning of the current broker day.

THIS WEEK

Analyzes qualifying deals from the beginning of the current week.

THIS MONTH

Analyzes qualifying deals from the first day of the current month.

ALL HISTORY

Analyzes the available qualifying account history.

The desired period can be selected from the indicator inputs.

Symbol Filtering

The indicator supports two primary symbol modes.

ALL SYMBOLS

Analyzes qualifying trading activity across all symbols.

CUSTOM SYMBOL

Restricts analysis to a specific trading instrument.

If a custom symbol is not specified while All Symbols is disabled, the current chart symbol is used.

Magic Number Filter

An optional Magic Number filter is included.

This can be particularly useful when multiple Expert Advisors operate on the same trading account.

For example, traders can configure:

                                                    Use Magic Filter = true
Magic Number     = 260026

Only qualifying deals associated with that Magic Number will then be included in the statistics.

Current Trading Status

In addition to historical statistics, the dashboard displays current account activity for the selected filters.

This includes:

                                                    OPEN POSITIONS       2
FLOATING P/L    +48.20 USD

This allows historical performance and current floating results to be viewed from the same dashboard.

Automatic Updates

The indicator uses a timer-based update system to automatically refresh statistics.

The default update interval is:

                                                    2 seconds

The interval can be adjusted from the indicator inputs.

Installation

Place:

Quantora_Trade_Statistics_Dashboard_MT5.mq5

inside:

MQL5 → Indicators

Compile the source code using MetaEditor.

Then attach Quantora Trade Statistics Dashboard MT5 to any MetaTrader 5 chart.

Select the desired:

  • Analysis Period
  • Symbol Mode
  • Custom Symbol
  • Magic Number Filter

The dashboard will automatically analyze the available trading history.

Important Note

Statistics are based on qualifying closed deals using MetaTrader 5 history records.

Partial position closures may therefore appear as separate closed deals.

Commission, swap and available fee information are included when calculating the net result of qualifying deals.

BUY and SELL statistics are based on the direction stored in qualifying closing deal records.

The amount of historical data available depends on the trading history accessible from the MetaTrader 5 terminal.

The statistics displayed by this indicator describe historical trading activity and do not guarantee future trading performance.

The indicator does not open, modify or close positions and does not generate BUY or SELL signals.

It is intended for trading analysis and informational purposes only.

Product Information

Version: 1.00
Platform: MetaTrader 5
Program Type: Indicator
Category: Trading Utilities / Performance Analytics
License: Free / Open Source

Developed by QUANTORA

Professional MetaTrader 5 Trading Tools, Indicators and Expert Advisors.

More Professional Quantora Trading Products

Explore Quantora's professional MetaTrader 5 Expert Advisors, premium indicators and trading tools on the official MQL5 Market:

View All Quantora Products on MQL5 Market →

Quantora Symbol Information Dashboard MT5 - Professional Symbol and Trading Specifications Panel Quantora Symbol Information Dashboard MT5 - Professional Symbol and Trading Specifications Panel

Professional open-source Symbol Information Dashboard for MetaTrader 5. Displays live prices, spread, tick value, contract size, lot limits, swaps, trading conditions, daily range and ATR in real time.

Quantora Trading Session Monitor MT5 - Professional Market Session and Activity Monitor Quantora Trading Session Monitor MT5 - Professional Market Session and Activity Monitor

Professional open-source Trading Session Monitor for MetaTrader 5. Tracks Sydney, Tokyo, London and New York sessions, overlaps, countdowns, spread, ATR and real-time market activity.

Quantora Drawdown Monitor MT5 - Professional Account Risk and Drawdown Dashboard Quantora Drawdown Monitor MT5 - Professional Account Risk and Drawdown Dashboard

Professional open-source Drawdown Monitor for MetaTrader 5. Tracks current, daily and peak-equity drawdown, floating P/L, margin levels and configurable account risk conditions in real time.

Quantora Market Volatility Monitor MT5 - Professional ATR and Volatility Dashboard Quantora Market Volatility Monitor MT5 - Professional ATR and Volatility Dashboard

Professional open-source Market Volatility Monitor for MetaTrader 5. Analyzes current ATR, average ATR, ATR ratio, daily range and spread to classify market volatility in real time.