Rejoignez notre page de fans
Quantora Market Volatility Monitor MT5 - Professional ATR and Volatility Dashboard - indicateur pour MetaTrader 5
- Vues:
- 118
- Publié:
-
Besoin d'un robot ou d'un indicateur basé sur ce code ? Commandez-le sur Freelance Aller sur Freelance
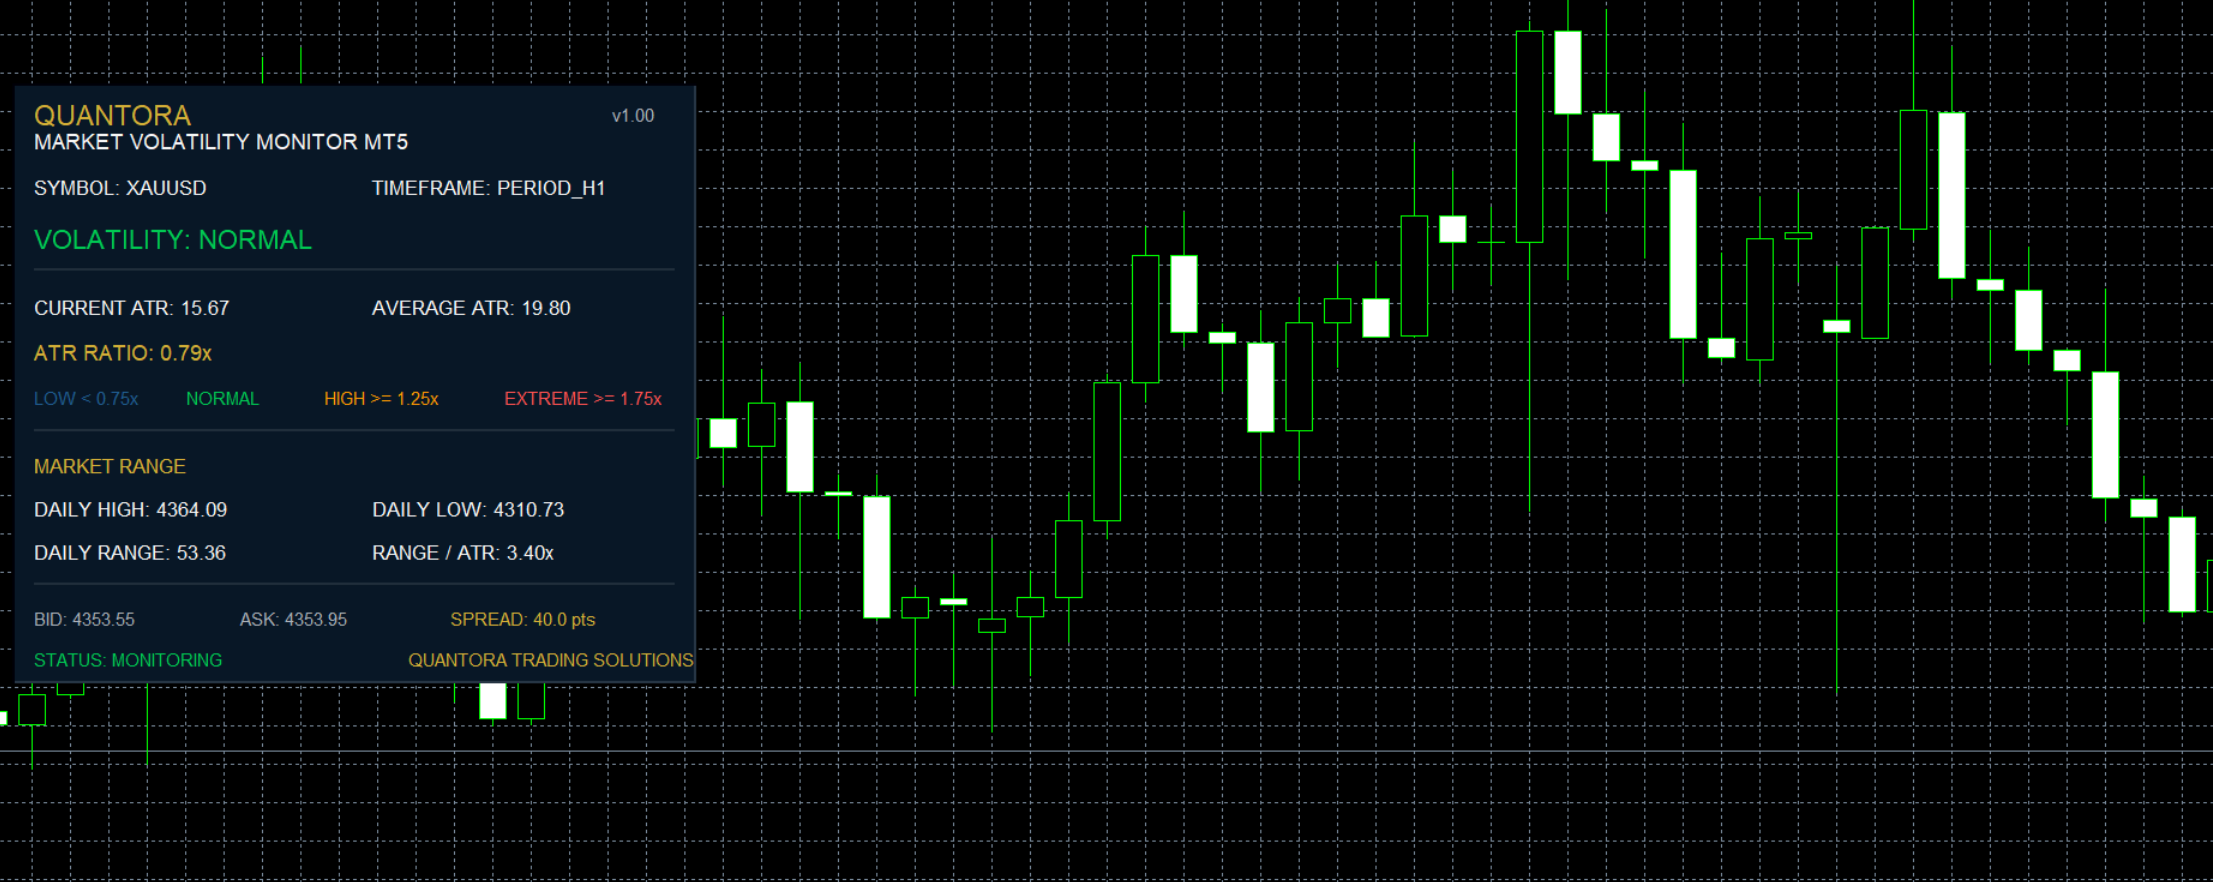
Quantora Market Volatility Monitor MT5 is a professional real-time volatility analysis indicator designed for MetaTrader 5.
The indicator measures current market volatility using Average True Range (ATR) and compares the current ATR with its historical average to determine whether market conditions are LOW, NORMAL, HIGH or EXTREME.
It also monitors Daily High, Daily Low, Daily Range, Range/ATR Ratio, Bid, Ask and Spread, providing traders with a compact overview of current market activity directly on the chart.
The tool is designed for traders who want to understand whether current price movement is relatively quiet or unusually volatile before making trading decisions.
Main Features
- Current ATR
- Historical Average ATR
- ATR Ratio
- LOW Volatility classification
- NORMAL Volatility classification
- HIGH Volatility classification
- EXTREME Volatility classification
- Configurable volatility thresholds
- Configurable ATR period
- Configurable ATR lookback
- Daily High
- Daily Low
- Daily Range
- Daily Range / ATR Ratio
- Live Bid
- Live Ask
- Current Spread in points
- Current Symbol information
- Current Timeframe information
- Automatic timer-based updates
- Professional Quantora dashboard
- Works on Forex, Gold, Indices, Crypto and CFDs where supported by the broker
- Works on all MetaTrader 5 chart timeframes
- Free and open-source MQ5 code
Volatility Classification
The main purpose of the indicator is to compare the current ATR with the historical average ATR.
The calculation is:
ATR Ratio =
Current ATR / Average ATR For example:
Current ATR = 14.82
Average ATR = 10.15
ATR Ratio = 1.46x An ATR Ratio of 1.46x means the current ATR is approximately 46% higher than the calculated historical ATR average.
Default Volatility Levels
The default classification thresholds are:
LOW
ATR Ratio < 0.75
NORMAL
ATR Ratio = 0.75 to < 1.25
HIGH
ATR Ratio = 1.25 to < 1.75
EXTREME
ATR Ratio >= 1.75 These thresholds can be changed from the indicator inputs.
For example:
Low Ratio = 0.75
High Ratio = 1.25
Extreme Ratio = 1.75 This allows traders to customize the volatility classification according to their strategy and market.
ATR Analysis
By default, the indicator uses:
ATR Period = 14
ATR Lookback = 50 The current ATR is calculated on the current chart timeframe.
The indicator then calculates an average from available previous ATR values within the configured lookback.
Example:
CURRENT ATR 4.82
AVERAGE ATR 3.64
ATR RATIO 1.32x
VOLATILITY HIGH This provides a relative measurement rather than relying only on the absolute ATR value.
Daily Range Analysis
The dashboard also monitors the current daily candle.
It displays:
DAILY HIGH
DAILY LOW
DAILY RANGE Daily Range is calculated as:
Daily Range =
Daily High - Daily Low Example:
DAILY HIGH 3382.60
DAILY LOW 3344.15
DAILY RANGE 38.45 This provides an additional view of how much the market has moved during the current broker trading day.
Range / ATR Ratio
The indicator compares the current daily range with the current ATR:
Range / ATR =
Daily Range / Current ATR Example:
Daily Range 38.45
Current ATR 14.82
Range / ATR 2.59x This statistic provides additional context about the current day's price range relative to the ATR of the selected chart timeframe.
Because the daily range and ATR may use different time horizons, this ratio should be treated as contextual information rather than a trading signal.
Live Market Information
The dashboard also displays current market pricing information:
SYMBOL XAUUSD
TIMEFRAME M15
BID 3368.42
ASK 3368.58
SPREAD 16.0 points Spread is calculated using:
(Ask - Bid) / Point This allows traders to monitor transaction conditions together with current volatility.
Practical Uses
Quantora Market Volatility Monitor can be useful for identifying changing market conditions.
For example, traders may use the dashboard to observe when:
- Volatility is unusually low
- Current volatility is near its recent average
- Market movement is expanding
- ATR increases significantly above its historical average
- Daily range becomes unusually large
- Spread expands during volatile conditions
The indicator itself does not determine whether these conditions are suitable for entering a trade.
Example Dashboard
QUANTORA
MARKET VOLATILITY MONITOR MT5
────────────────────────────────
SYMBOL XAUUSD
TIMEFRAME M15
VOLATILITY HIGH
CURRENT ATR 14.82
AVERAGE ATR 10.15
ATR RATIO 1.46x
LOW < 0.75x
NORMAL 0.75 - 1.25x
HIGH 1.25 - 1.75x
EXTREME >= 1.75x
DAILY MARKET
DAILY HIGH 3382.60
DAILY LOW 3344.15
DAILY RANGE 38.45
RANGE / ATR 2.59x
BID 3368.42
ASK 3368.58
SPREAD 16.0 points
STATUS: MONITORING Automatic Updates
The indicator uses a timer-based update system.
Default:
Update Interval = 1 second Bid, Ask, Spread and volatility statistics are automatically refreshed while the indicator is running.
Installation
Place:
Quantora Market Volatility Monitor MT5.mq5
inside:
MQL5 → Indicators
Compile the source file using MetaEditor.
Then attach Quantora Market Volatility Monitor MT5 to any MetaTrader 5 chart.
The indicator will automatically begin monitoring the current chart symbol and timeframe.
Important Notes
ATR is calculated using the current chart timeframe.
Therefore, changing from M5 to M15, H1 or another timeframe will change the volatility analysis.
The Average ATR calculation depends on available historical ATR data and the selected lookback period.
Daily High and Daily Low are obtained from the current D1 candle supplied by MetaTrader 5.
Spread and price information depend on live data supplied by the connected broker.
Volatility classifications are relative statistical measurements and should not be interpreted as BUY or SELL signals.
The indicator does not:
- Open trades
- Close trades
- Modify positions
- Generate BUY signals
- Generate SELL signals
- Predict future volatility
- Guarantee future market behavior
It is designed for market monitoring and analytical purposes only.
Product Information
Version: 1.00
Platform: MetaTrader 5
Program Type: Indicator
Category: Trading Utilities / Market Analysis
License: Free / Open Source
Developed by QUANTORA
Professional MetaTrader 5 Trading Tools, Indicators and Expert Advisors.
More Professional Quantora Trading Products
Explore Quantora's professional MetaTrader 5 Expert Advisors, premium indicators and trading tools on the official MQL5 Market:
Quantora Drawdown Monitor MT5 - Professional Account Risk and Drawdown Dashboard
Professional open-source Drawdown Monitor for MetaTrader 5. Tracks current, daily and peak-equity drawdown, floating P/L, margin levels and configurable account risk conditions in real time.
Quantora Trade Statistics Dashboard MT5 - Professional Trading Performance Analytics
Professional open-source Trade Statistics Dashboard for MetaTrader 5. Analyzes trading history with win rate, profit factor, reward/risk, streaks, BUY/SELL performance, lot statistics and floating P/L.
Quantora Multi-Timeframe Trend Dashboard MT5 - Professional EMA Trend Analysis
Professional open-source Multi-Timeframe Trend Dashboard for MetaTrader 5. Analyzes M1 to D1 using EMA 20, EMA 50 and price position to identify Bullish, Bearish and Neutral market conditions.
Quantora Multi-Timeframe RSI Dashboard MT5 - Professional RSI Momentum Analysis
Professional open-source Multi-Timeframe RSI Dashboard for MetaTrader 5. Analyzes RSI across M1, M5, M15, M30, H1, H4 and D1 to monitor momentum, overbought and oversold conditions in real time.
