Rejoignez notre page de fans

3TF_RSI_Average - indicateur pour MetaTrader 5
- Vues:
- 7593
- Note:
- Publié:
-
 Vous manquez des opportunités de trading :
- Applications de trading gratuites
- Plus de 8 000 signaux à copier
- Actualités économiques pour explorer les marchés financiers
Inscription Se connecterVous acceptez la politique du site Web et les conditions d'utilisation
Si vous n'avez pas de compte, veuillez vous inscrire -
 Besoin d'un robot ou d'un indicateur basé sur ce code ? Commandez-le sur Freelance
Aller sur Freelance
Besoin d'un robot ou d'un indicateur basé sur ce code ? Commandez-le sur Freelance
Aller sur Freelance
'Three timeframes RSI Average' displays in a separate window three Relative Strength Index indicator of the specified timeframes, as well as their average value.
It has ten input parameters:
- RSI period - RSI calculation period
- Overbought - overbought level
- Oversold - oversold level
- Drawing mode - indicator drawing type
- Steps - as a ladder
- Slope - sloping lines
- First RSI timeframe - the timeframe of the first RSI
- Second RSI timeframe - the timeframe of the second RSI
- Third RSI timeframe - the timeframe of the third RSI
- Show first RSI - show the first RSI indicator
- Show second RSI - show the second RSI indicator
- Show third RSI - show the third RSI indicator
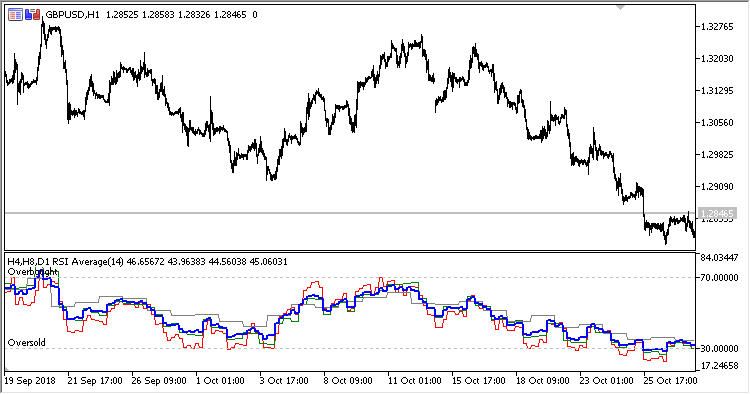
Fig.1. Three timeframes RSI Average, H4, H8 and D1 data on the H1 chart, Drawing mode = Steps
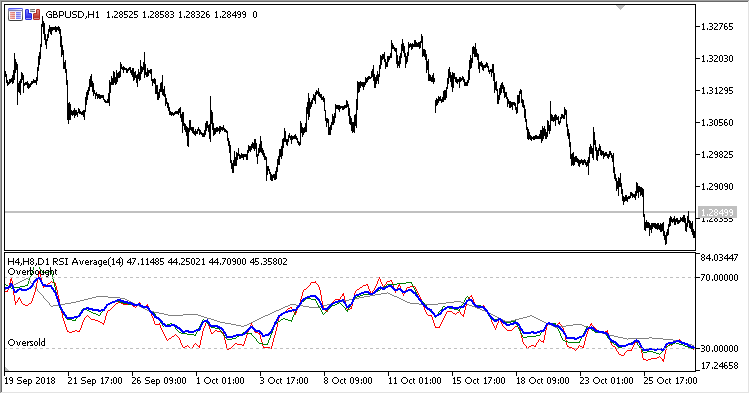
Fig. 2. Three timeframes RSI Average, H4, H8 and D1 data on the H1 chart, Drawing mode = Slope
Traduit du russe par MetaQuotes Ltd.
Code original : https://www.mql5.com/ru/code/23317
3TF_Stochastic_Average
The Three timeframes Stochastic Average indicator
Tymen_STARC_Bands
The Tymen STARC Bands indicator
 Dynamic averaging
The EA implements averaging of positions. The average iStdDev is calculated in a sliding window.
ColorRSI_X20_Cloud_HTF
The ColorRSI_X20_Cloud indicator with the possibility to change the indicator timeframe using input parameters