 MetaTrader 5
 Experts
 Indicateurs
 Scripts
 Bibliothèque
 Stockage
Voir comment télécharger gratuitement des robots de trading
Retrouvez-nous sur Facebook !
Rejoignez notre page de fans
Rejoignez notre page de fans
Vous avez aimé le script ? Essayez-le dans le terminal MetaTrader 5

Traders_Dynamic_Index - indicateur pour MetaTrader 5

- Vues:
- 34785
- Note:
- Publié:
- Mise à jour:
-
 Vous manquez des opportunités de trading :
- Applications de trading gratuites
- Plus de 8 000 signaux à copier
- Actualités économiques pour explorer les marchés financiers
Inscription Se connecterVous acceptez la politique du site Web et les conditions d'utilisation
Si vous n'avez pas de compte, veuillez vous inscrire -
 Besoin d'un robot ou d'un indicateur basé sur ce code ? Commandez-le sur Freelance
Aller sur Freelance
Traders Dynamic Index oscillator defines and displays trend direction, as well as market power and volatility.
The indicator features eleven customizable parameters:
- RSI period - RSI calculation period
- RSI applied price
- Volatility band period
- RSI smoothing period
- RSI smoothing method
- Signal smoothing period
- Signal smoothing method
- Overbought - overbought level
- Oversold - oversold level
- Show Market Base line (Yes/No)
- Show Volatility band lines (Yes/No)
Interpretation:
In general case:
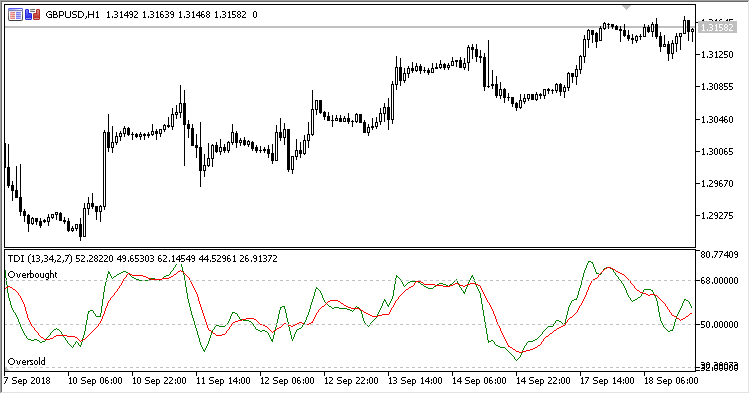
when the green RSI line goes over the red one, it means the market is bullish. when the green RSI line is below the red one, it means the market is bearish.
Base market line:
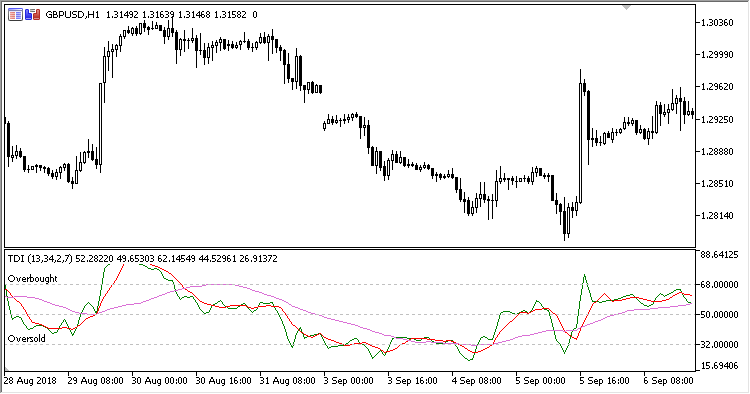
It is recommended to trade when the line is in the range from the overbought to the oversold level. When the market base line approaches the range borders, expect a trend direction change.
Volatility bands:
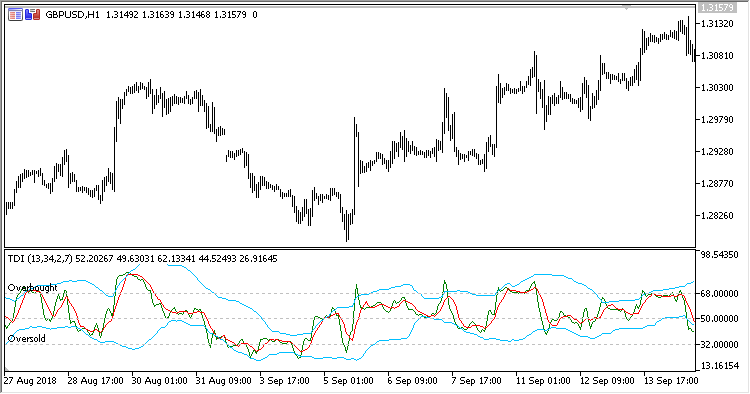
when the market is fast and active, the bands expand - trade in the direction of RSI and signal lines. During quiet periods, consolidations, waiting for news, etc., the bands are narrowed. If the bands are in a narrow range for a long time, expect a strong price spike and start of movement.
Traduit du russe par MetaQuotes Ltd.
Code original : https://www.mql5.com/ru/code/22777
 FineTuningMACandle_Chl_Arr
FineTuningMACandle_Chl indicator replaces signal candles with signal flags, which are visually more convenient in most cases
FineTuningMACandle_Chl
Indicator FineTuningMACandle with two colored channels based on standard deviations from the High and Low of the indicator candles