Rejoignez notre page de fans

Historical Volatility - High/Low - indicateur pour MetaTrader 5

- Vues:
- 8628
- Note:
- Publié:
-
 Vous manquez des opportunités de trading :
- Applications de trading gratuites
- Plus de 8 000 signaux à copier
- Actualités économiques pour explorer les marchés financiers
Inscription Se connecterVous acceptez la politique du site Web et les conditions d'utilisation
Si vous n'avez pas de compte, veuillez vous inscrire -
 Besoin d'un robot ou d'un indicateur basé sur ce code ? Commandez-le sur Freelance
Aller sur Freelance
Besoin d'un robot ou d'un indicateur basé sur ce code ? Commandez-le sur Freelance
Aller sur Freelance
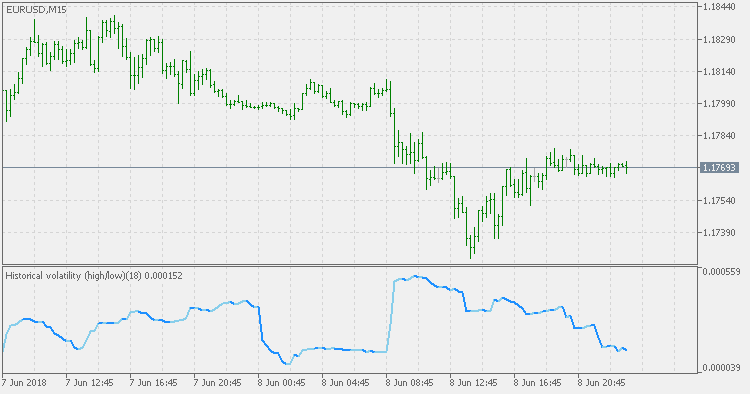
Historical Volatility (HV) is a statistical measure of the dispersion of returns for a given security or market index over a given period of time. Generally, this measure is calculated by determining the average deviation from the average price of a financial instrument in the given time period. Using standard deviation is the most common, but not the only, way to calculate Historical Volatility.
The higher the Historical Volatility value, the riskier the security. However, that is not necessarily a bad result as risk works both ways - bullish and bearish, i.e: Historical Volatility is not a directional indicator and should not be used as other directional indicators are used. Use to to determine the rising and falling price change volatility.
This version also does not use Close prices for volatility calculation. Instead it uses the High/Low ratio (the calculation is different from the "regular" Historical Volatility indicator).
Historical Volatility
Historical Volatility (HV) is a statistical measure of the dispersion of returns for a given security or market index over a given period of time. Generally, this measure is calculated by determining the average deviation from the average price of a financial instrument in the given time period.
BB Stops - Smoothed WPR
BB Stops indicator of smoothed WPR.
Historical Volatility Bands
Historical Volatility Bands constructed using average as the middle line, and upper and lower bands using the Historical Volatility for bands calculation.
RSI Сandles - Smoothed with Trend Envelopes
RSI Candles with an additional option to filter (smooth) the prices prior to using them in RSI calculation (which, effectively makes it an RSI of average).