Rejoignez notre page de fans
- Vues:
- 10822
- Note:
- Publié:
- Mise à jour:
-
Besoin d'un robot ou d'un indicateur basé sur ce code ? Commandez-le sur Freelance Aller sur Freelance
As described in the May 2018 edition of Technical Analysis of Stocks & Commodities by John F. Ehlers. This indicators is an enhancement to the traditional RSI for detecting cyclical reverses.
This indicator has two settings:
- RSILength - This needs to be half the dominant cycle period. For example, if applying to stocks or stock indexes, the cycle period would be monthly (20 Bars on a daily chart) so you would set this variable to 10.
- Smooth - The smoothing parameter of the indicator to control volatile swings. This should be set to no more than the value of RSILength.
How to use this indicator in practice:
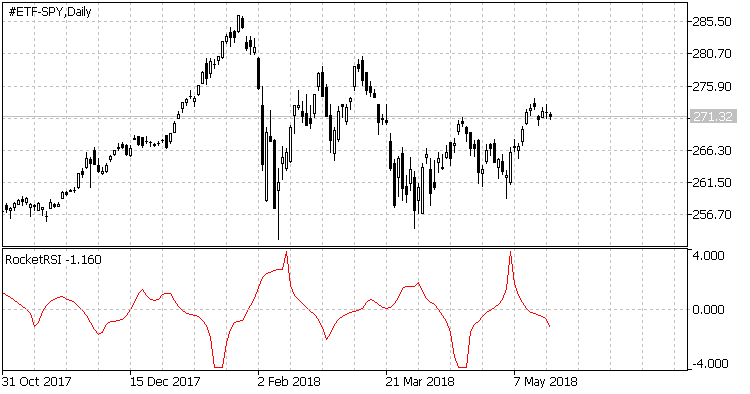
- If the indicator spikes below -2, this shows a high probability of a bullish reversal and is therefore a buy signal.
- If the indicator spikes above 2, this shows a high probability of a bearish reversal and is therefore a sell signal.
An example of this indicator is shown in the image below.

 Rainbow Oscillator
The Rainbow Oscillator indicator is mainly intended to show the trend of the market. But, using the levels you can use it to assess overbought and oversold conditions too.
 Range Oscillator + Bands
Unlike the basic Range Oscillator version, this version uses Bollinger Bands for overbought and oversold conditions assessment.
 Rainbow Oscillator - Binary
Based on Mel Widner's Rainbow Average (that is similar to Guppy MMA), here is a binary version of Rainbow Oscillator.
 Bollinger Bands - EMA Deviation
This version of Bollinger Bands does not use standard deviation for Upper and Lower Bands, but uses the EMA deviation.