|
8+ años
experiencia
|
32
productos
|
147
versiones demo
|
|
0
trabajos
|
0
señales
|
0
suscriptores
|
👑 Físico teórico, programador, trader con 15 años de experiencia.
-------------------------------------------------------------------------------
💰 Productos presentados:
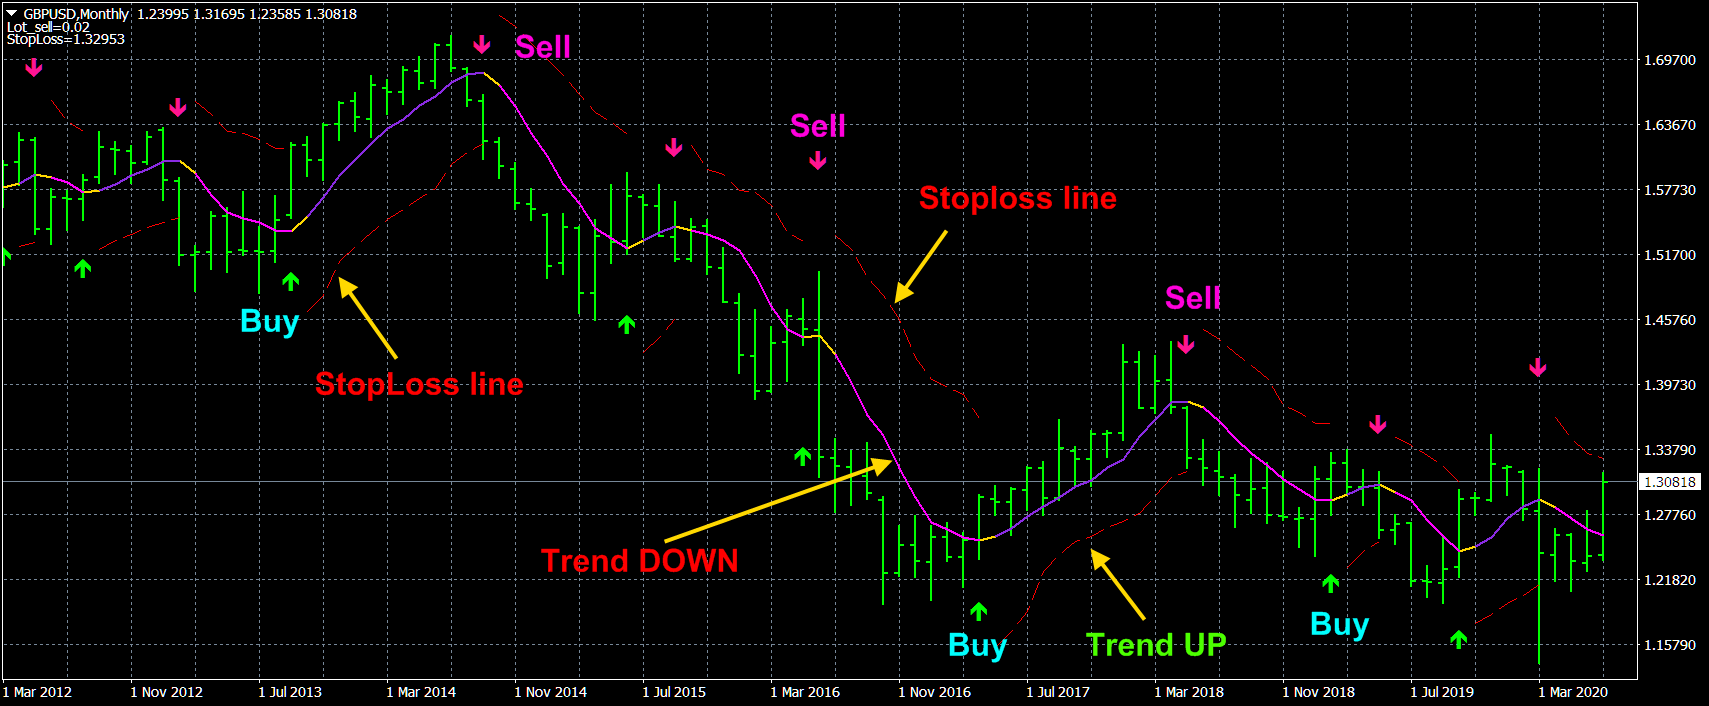
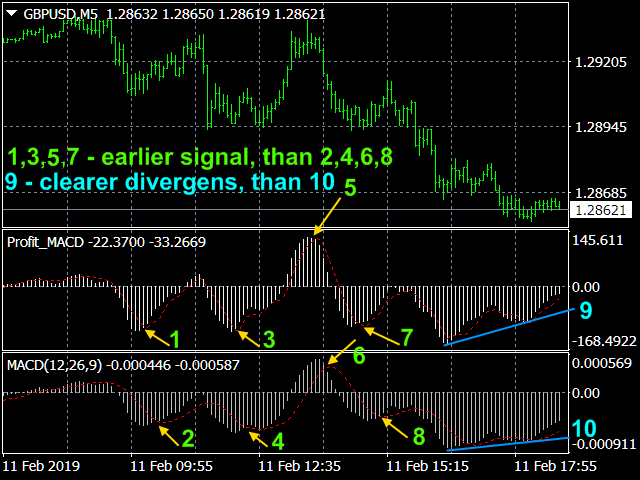
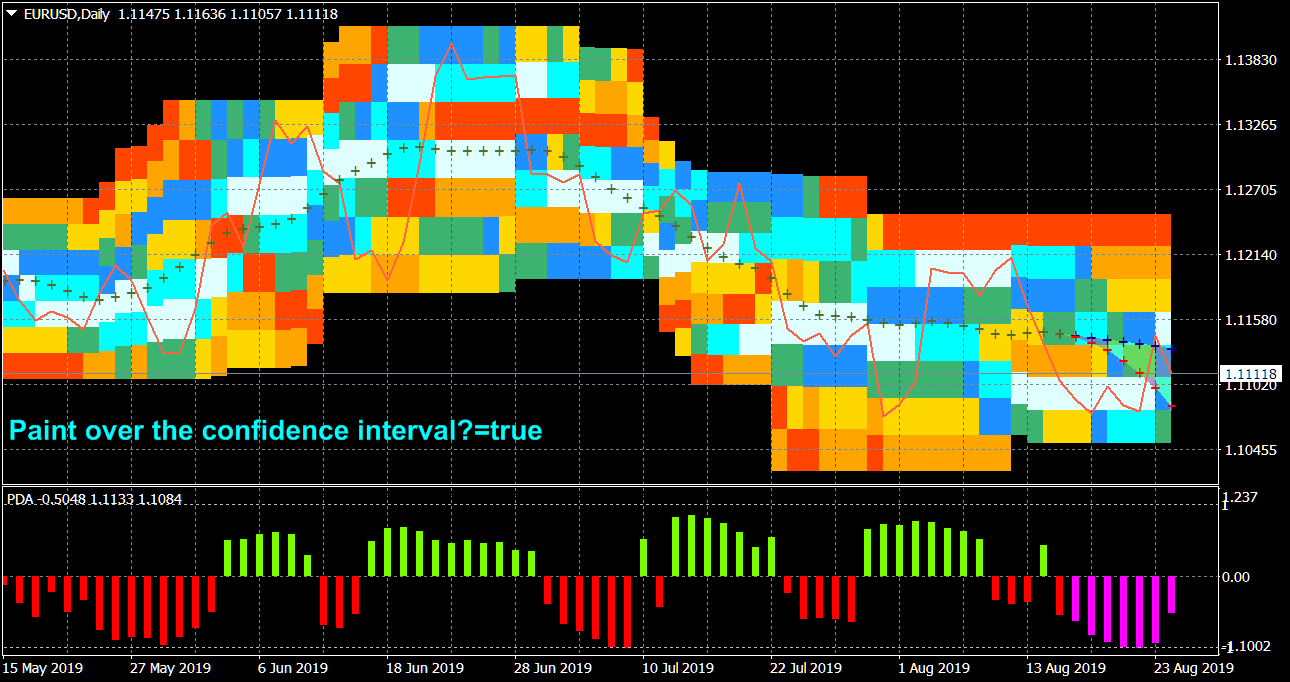
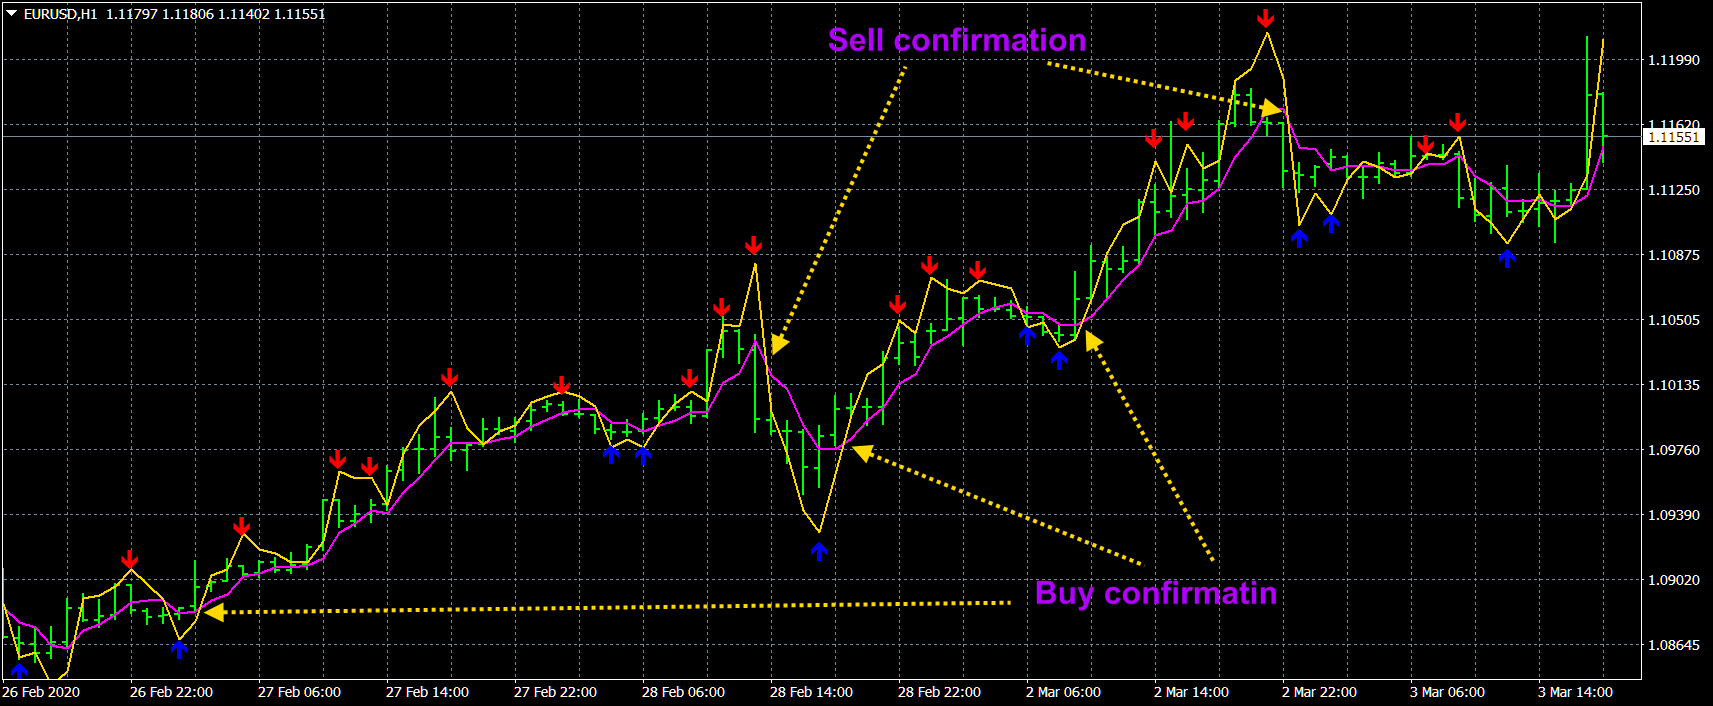
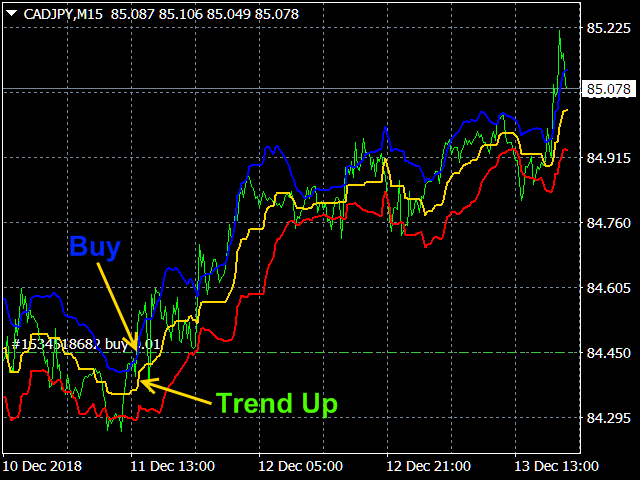
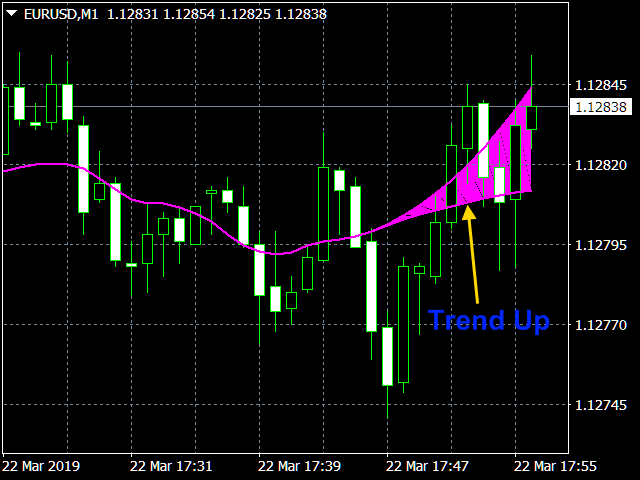
1) 🏆 Indicadores con filtrado óptimo de ruidos de mercado (para elegir puntos de apertura y cierre de posiciones).
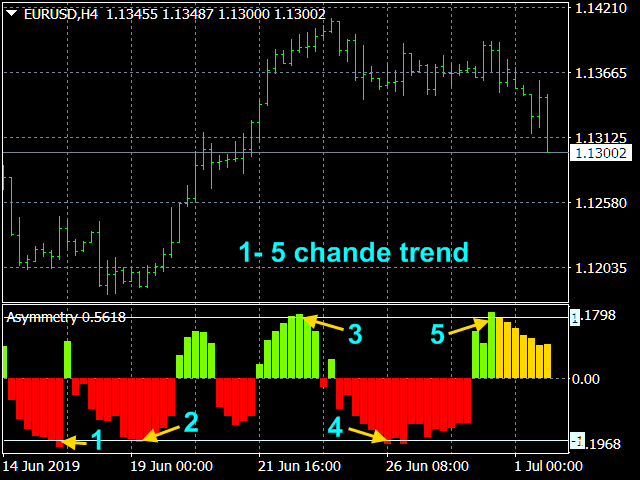
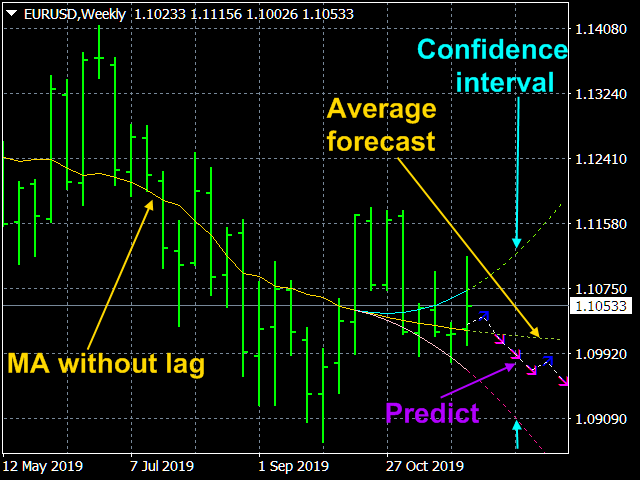
2) 🏆 Indicadores estadísticos (para determinar la tendencia global).
3) 🏆 Indicadores de investigación de mercado (para aclarar la microestructura de precios, construir canales, identificar diferencias entre reversiones de tendencias globales y reversiones locales).
-------------------------------------------------------------------------------
☛ Más información en el blog https://www.mql5.com/en/blogs/post/741637
-------------------------------------------------------------------------------
💰 Productos presentados:
1) 🏆 Indicadores con filtrado óptimo de ruidos de mercado (para elegir puntos de apertura y cierre de posiciones).
2) 🏆 Indicadores estadísticos (para determinar la tendencia global).
3) 🏆 Indicadores de investigación de mercado (para aclarar la microestructura de precios, construir canales, identificar diferencias entre reversiones de tendencias globales y reversiones locales).
-------------------------------------------------------------------------------
☛ Más información en el blog https://www.mql5.com/en/blogs/post/741637

Aleksey Ivanov

· 1
votija.63
2023.02.28
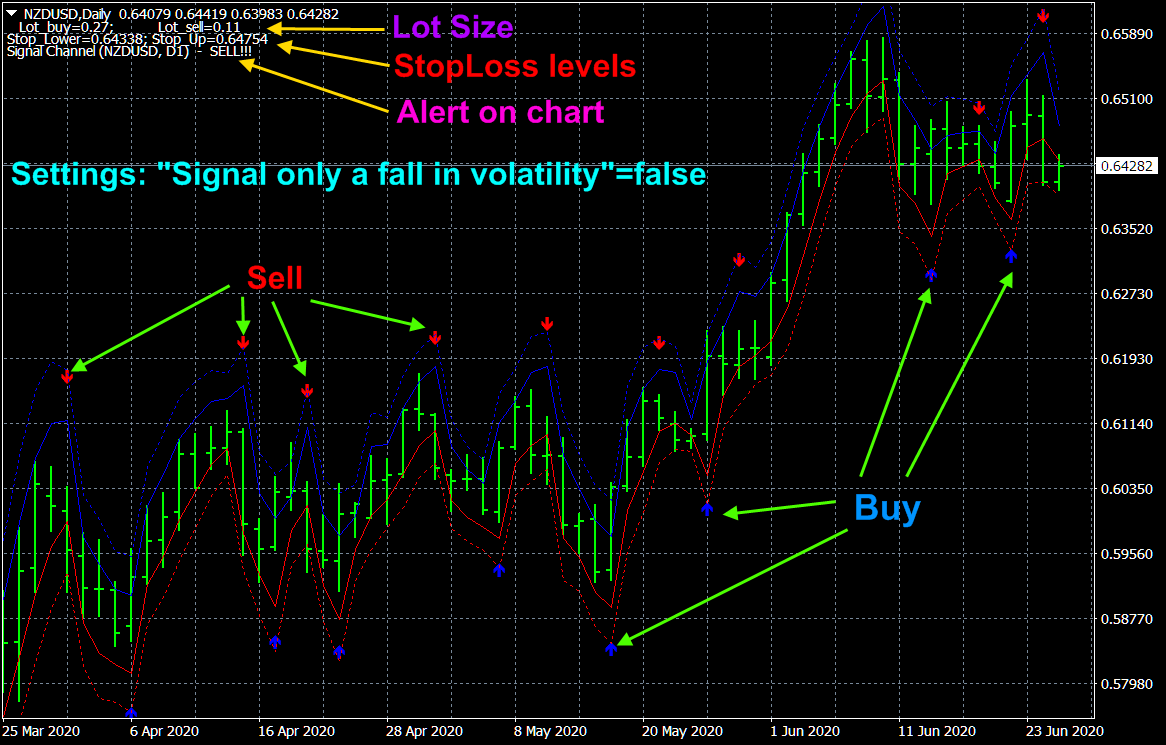
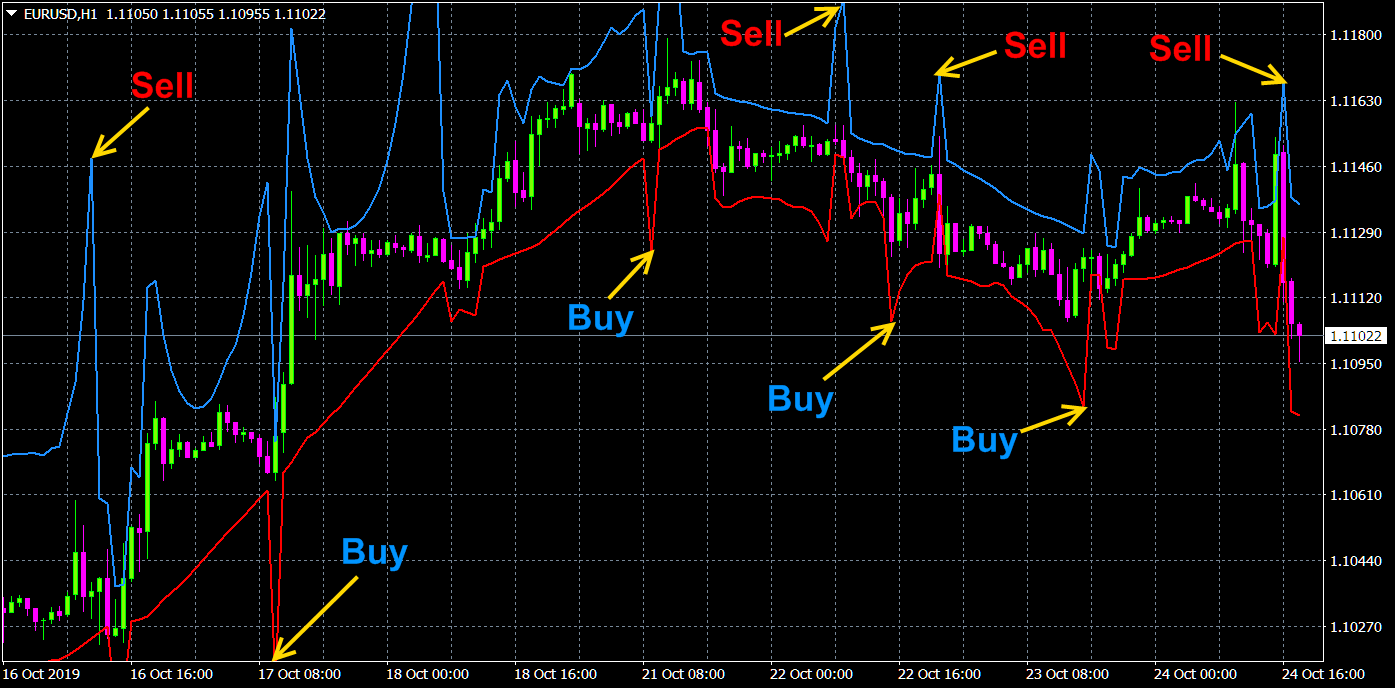
I don't know about you!! but red, everyone associates it with sell, and blue or green with buy!!! I don't want to think how good it is!!
Aleksey Ivanov
2023.03.01
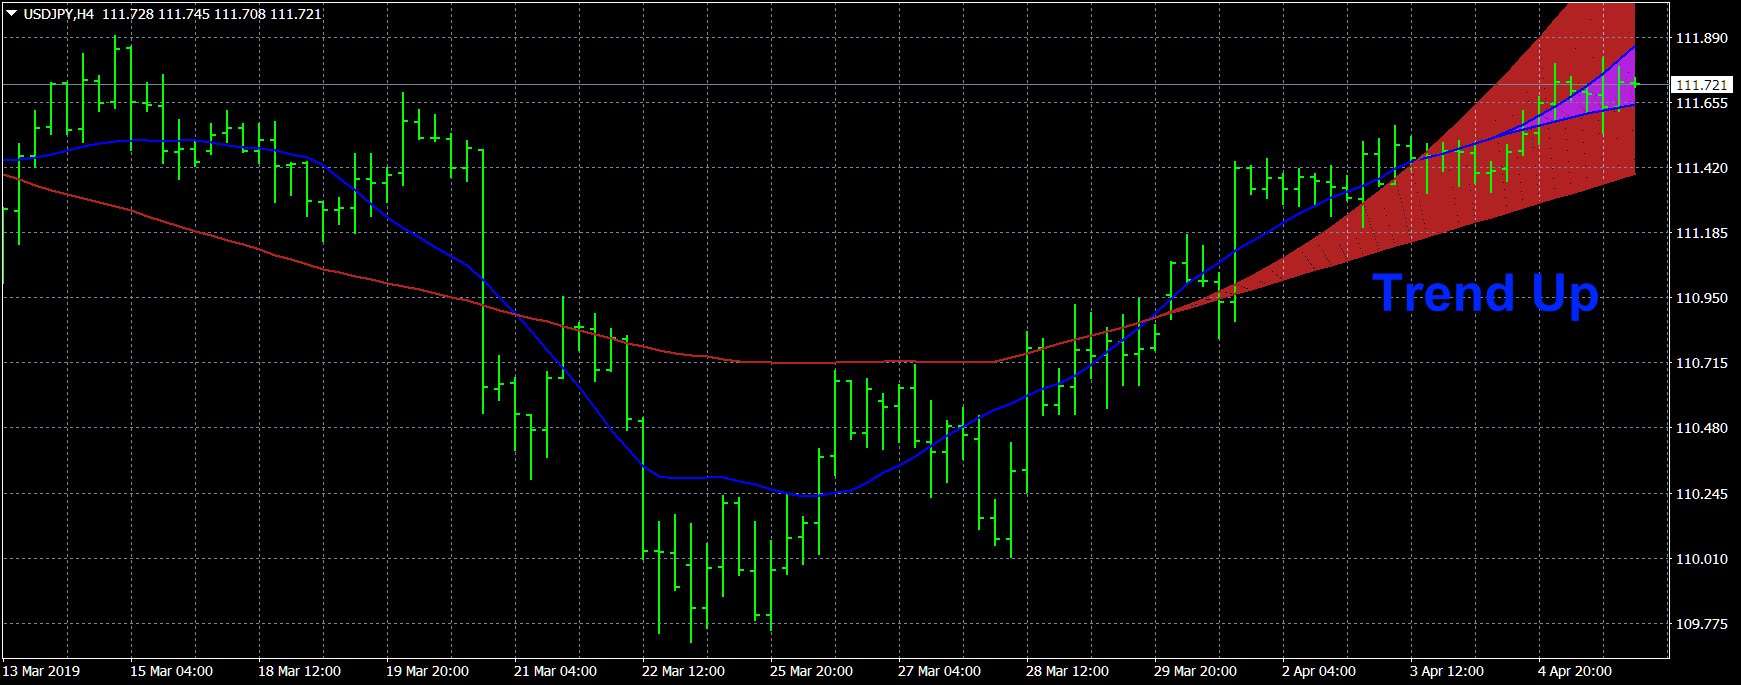
The red line is the lower border of the channel. The blue line is the upper border of the channel.
Aleksey Ivanov
2023.03.01
In another indicator mode, arrows with your favorite colors are shown.