Aleksey Ivanov / Perfil
- Información
|
8+ años
experiencia
|
32
productos
|
146
versiones demo
|
|
0
trabajos
|
0
señales
|
0
suscriptores
|
-------------------------------------------------------------------------------
💰 Productos presentados:
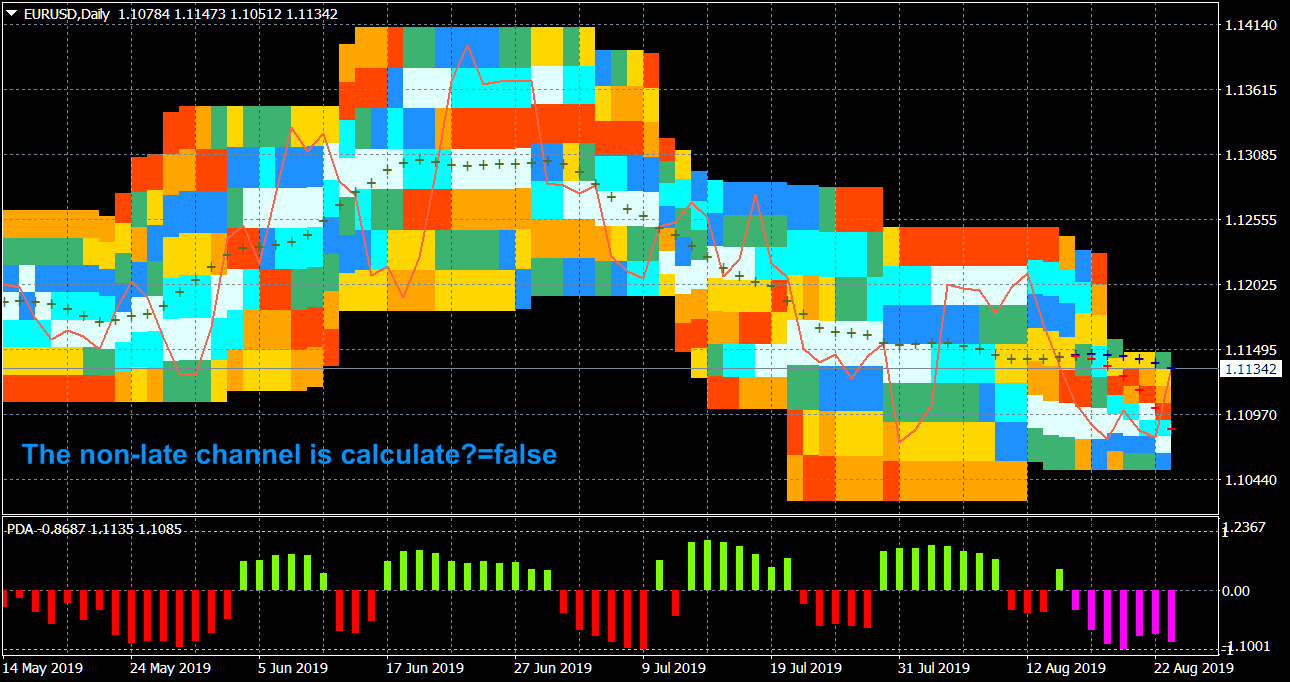
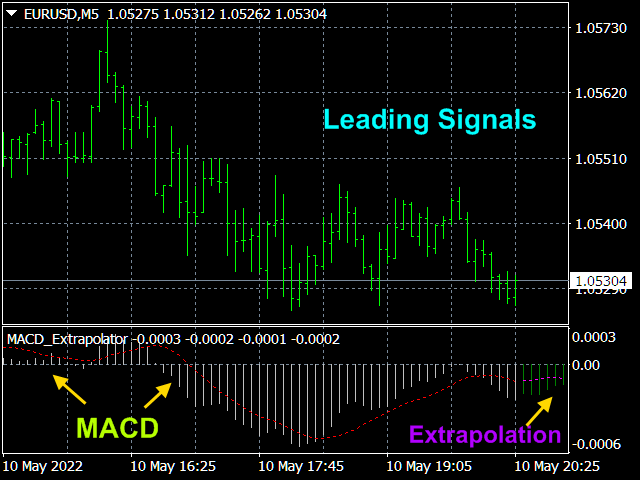
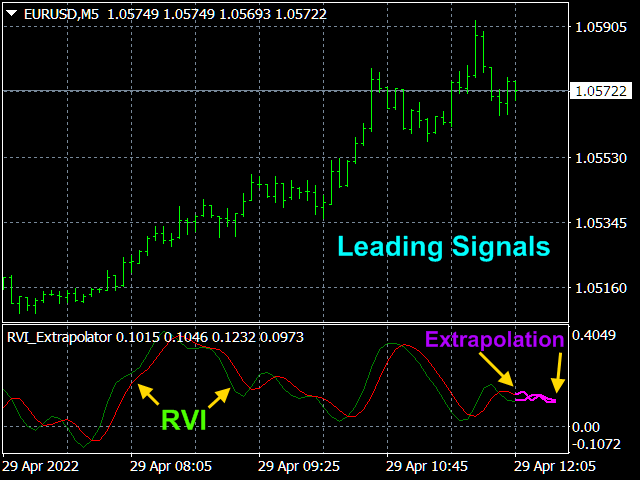
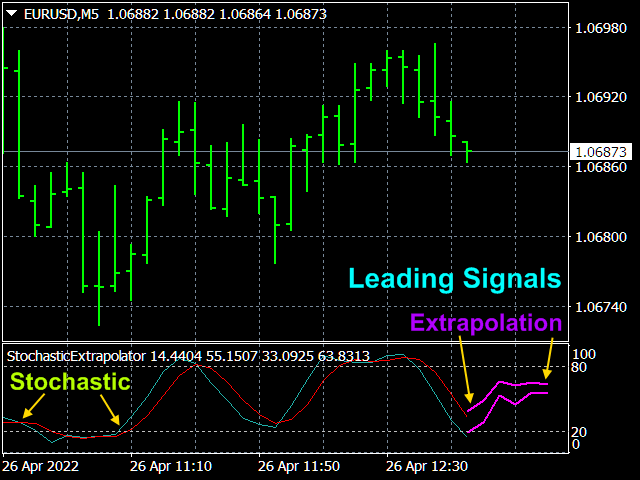
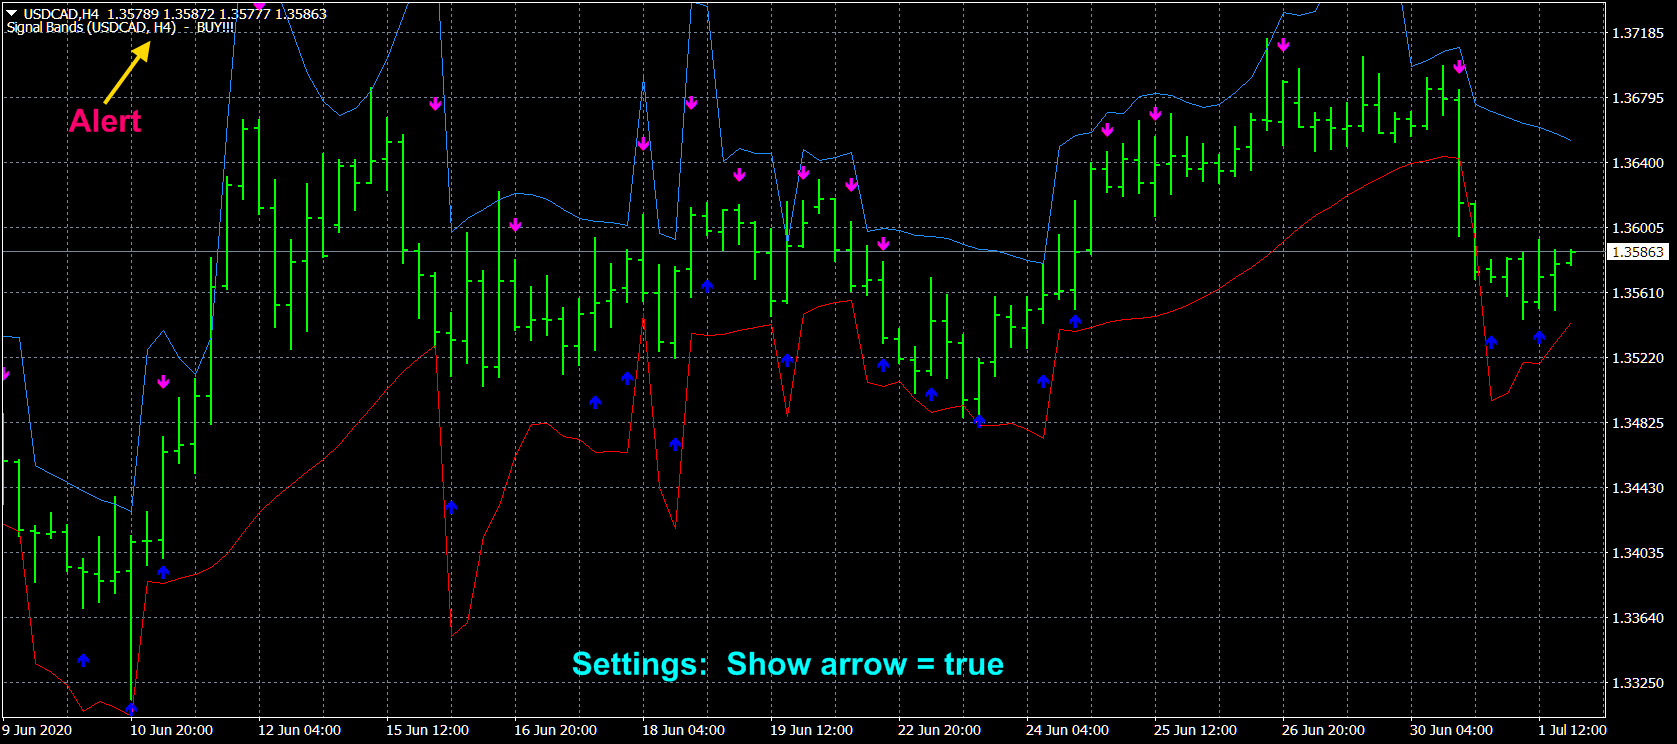
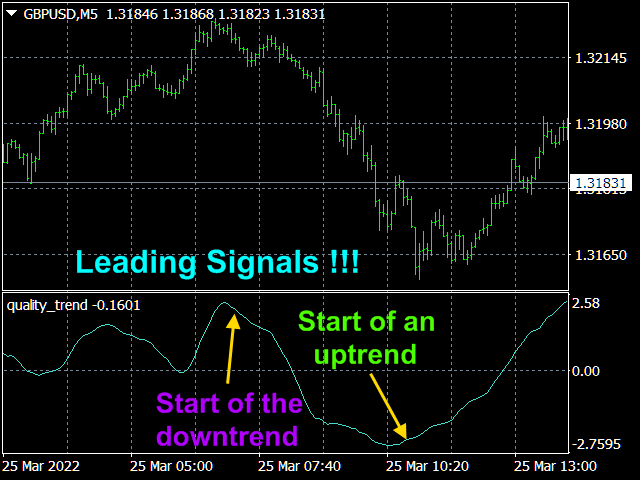
1) 🏆 Indicadores con filtrado óptimo de ruidos de mercado (para elegir puntos de apertura y cierre de posiciones).
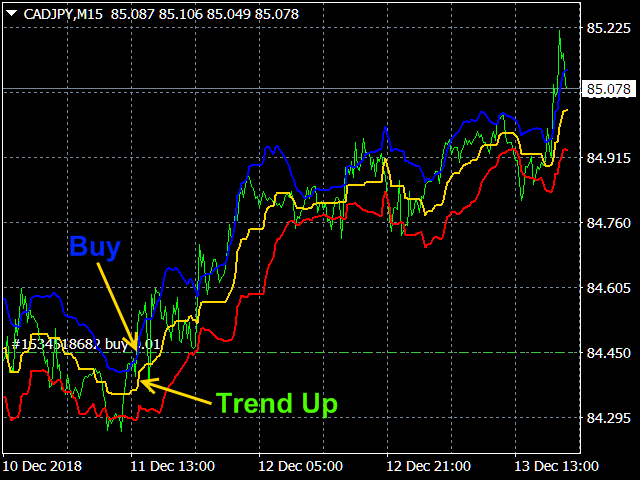
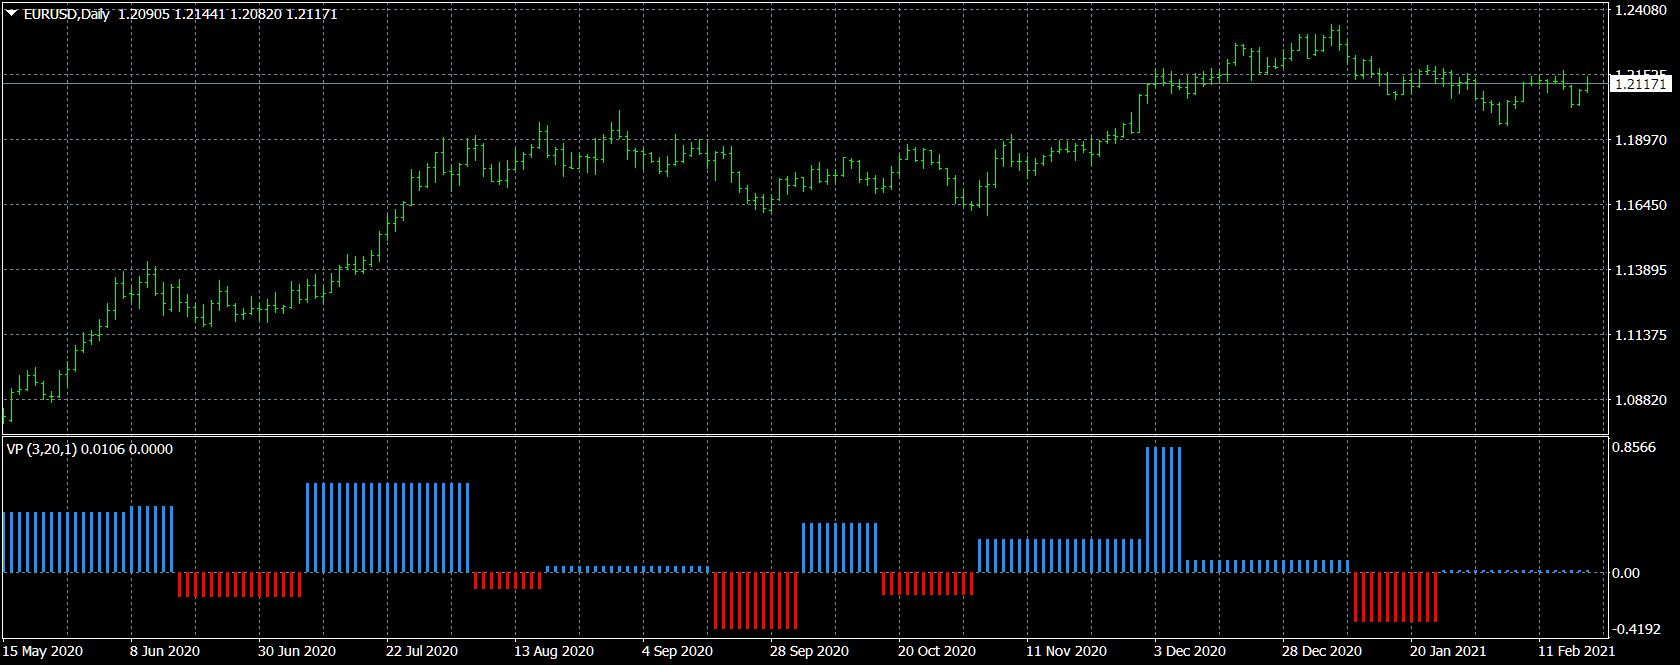
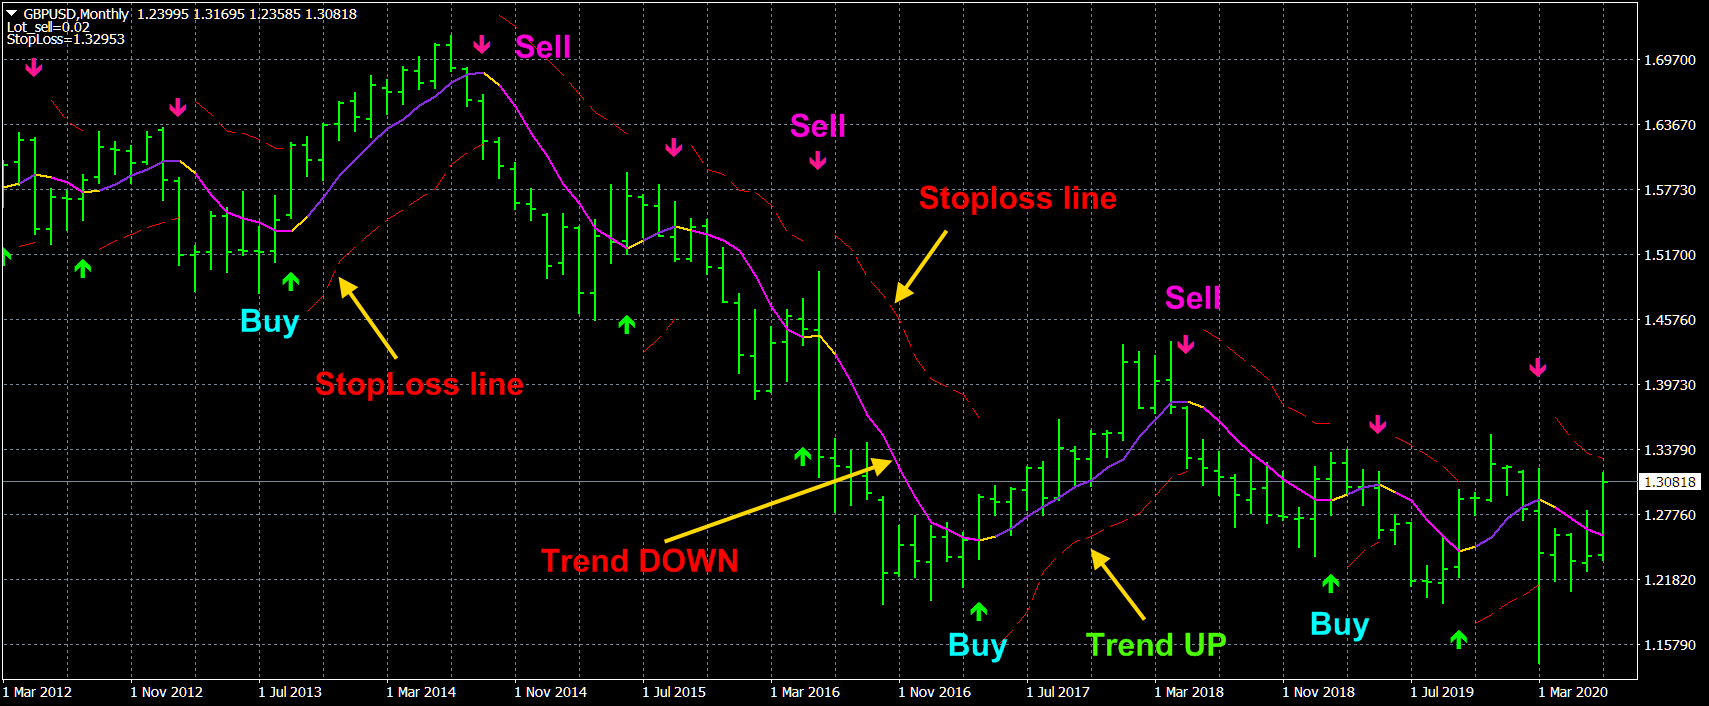
2) 🏆 Indicadores estadísticos (para determinar la tendencia global).
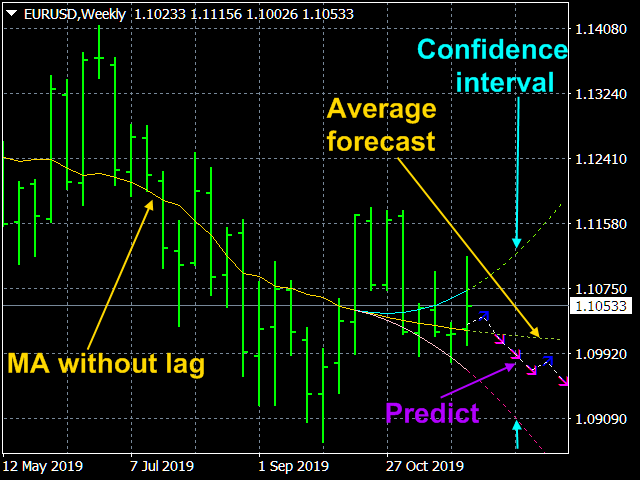
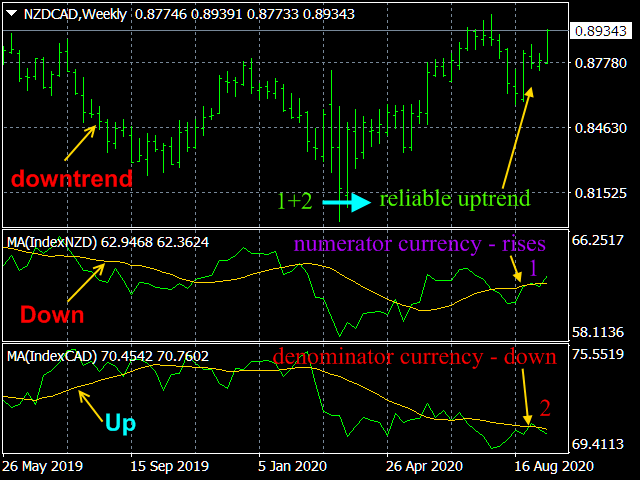
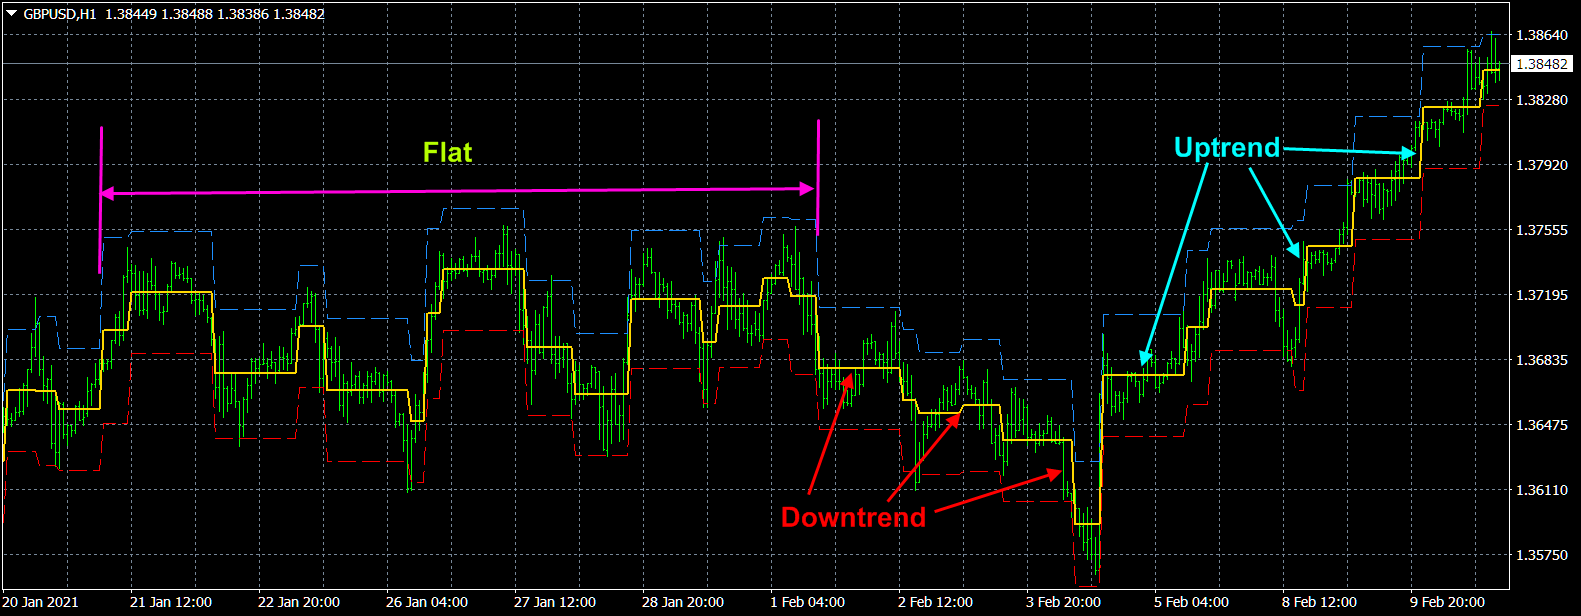
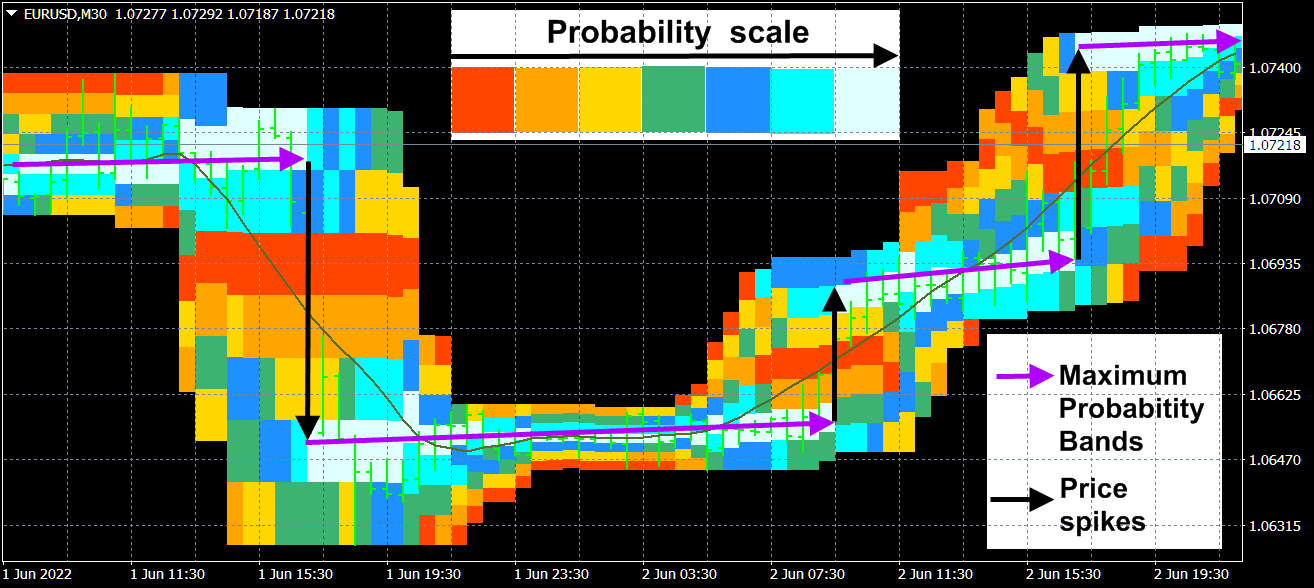
3) 🏆 Indicadores de investigación de mercado (para aclarar la microestructura de precios, construir canales, identificar diferencias entre reversiones de tendencias globales y reversiones locales).
-------------------------------------------------------------------------------
☛ Más información en el blog https://www.mql5.com/en/blogs/post/741637
El indicador se utiliza para: definir las distribuciones de probabilidad de los precios. Esto permite representar detalladamente el canal y sus fronteras y prever la probabilidad de que un precio aparezca en cada segmento de sus fluctuaciones; definir el momento de cambio del canal. Principios de funcionamiento y características El indicador analiza un historial de cotizaciones en los marcos temporales inferiores y calcula una distribución de probabilidad de precios en los superiores. Los
The Absolute Bands indicator is reminiscent of the Bollinger Bands indicator with its appearance and functions, but only more effective for trading due to the significantly smaller number of false signals issued to them. This effectiveness of the Absolute Bands indicator is due to its robust nature.
✔️ One of the best indicators with optimal market noise filtering.
✔️The indicator predicts the price in accordance with the prevailing trend and its own small statistical price fluctuations around this trend. Using mathematical methods for predicting random processes, StatPredict indicator predicts the most probable values of the future price and calculates the confidence interval for them.
✔️StatPredict also provides the option to calculate the lot, based on the positions of the last points of the calculated channel of confidence probability, as well as the size of the deposit and the allowable risk, which are specified in the indicator settings.
✔️The algorithms of this indicator are unique and developed by their author
The Velocity of price change indicator shows the average rate of price change at those characteristic time intervals where this rate was approximately constant. The robust algorithm used in Velocity of price change to smooth out the price from its random jumps, ensures the reliability of the indicator reading, which does not react to simple price volatility and its insignificant movements.
✔️The algorithms of this indicator are unique and developed by their author
El indicador Velocidad de variación de los precios ( VP ) muestra la tasa media de variación de los precios en aquellos intervalos de tiempo característicos en los que esta tasa fue aproximadamente constante. El robusto algoritmo utilizado en VP para suavizar el precio de sus saltos aleatorios, garantiza la fiabilidad de la lectura del indicador, que no reacciona a la simple volatilidad del precio y sus movimientos insignificantes. El indicador permite seguir las tendencias y los momentos de sus
✔️ This indicator is intended for professionals assessing fundamental market trends. This indicator calculates the index of any instrument and analyzes it.
✔️ The indicator has modes for analyzing the indices themselves, namely: Moving Average; Relative Strength Index; Momentum; Commodity Channel Index; Bollinger Bands; Envelopes.
Este indicador está destinado a los profesionales que evalúan las tendencias fundamentales del mercado. Este indicador calcula el índice de cualquier instrumento y lo analiza. El índice de la divisa del estado muestra el poder adquisitivo real de esta divisa, y la dinámica de este índice muestra la dinámica del estado económico del estado correspondiente. Un análisis de los índices de ambas divisas incluidas en un par de divisas hace que sea mucho más fiable identificar la tendencia de este par
The TrueChannel indicator shows us the true price movement channels. This indicator resembles Donchian Channel in its appearance, but is built on the basis of completely different principles and gives (in comparison with Donchian Channel, which is better just to use to assess volatility) more adequate trading signals.
✔️The algorithms of this indicator are unique and developed by their author
Part 2 https://www.mql5.com/en/articles/11158 and
the author of the well-known Identify Trend indicator https://www.mql5.com/en/market/product/36336 .
✔️The algorithms of most indicators (Modern profitable indicators https://www.mql5.com/en/blogs/post/741637 ) are unique and developed by their author.
The indicator predicts the future values of the MACD indicator, which allows you to use this indicator much more efficiently.
The market has a very short memory; in any case, the information that formally describes it quickly becomes obsolete and loses its weight in the formation of the current price. Therefore, wavelet analysis is the most promising for predicting future market parameters. The author uses a number of wavelet functions (including the Morlet wavelet and a somewhat modified Gaussian function, which are shown in the last screenshot), the expansion by which, with a sufficient degree of reliability, allows extrapolating future values of oscillator indicators.
The indicator predicts the future values of the Relative Vigor Index indicator, which allows you to use this indicator much more efficiently.
The market has a very short memory; in any case, the information that formally describes it quickly becomes obsolete and loses its weight in the formation of the current price. Therefore, wavelet analysis is the most promising for predicting future market parameters. The author uses a number of wavelet functions (including the Morlet wavelet and a somewhat modified Gaussian function, which are shown in the last screenshot), the expansion by which, with a sufficient degree of reliability, allows extrapolating future values of oscillator indicators.
The indicator predicts the future values of the Stochastic indicator, which allows you to use this indicator much more efficiently.
The market has a very short memory; in any case, the information that formally describes it quickly becomes obsolete and loses its weight in the formation of the current price. Therefore, wavelet analysis is the most promising for predicting future market parameters. The author uses a number of wavelet functions (including the Morlet wavelet and a somewhat modified Gaussian function, which are shown in the last screenshot), the expansion by which, with a sufficient degree of reliability, allows extrapolating future values of oscillator indicators.
Signal Bands is a sensitive and convenient indicator, which performs deep statistical processing of information. It allows to see on one chart (1) the price trend, (2) the clear price channel and (3) latent signs of trend change. The indicator can be used on charts of any periods, but it is especially useful for scalping due to its high sensitivity to the current market state.
✔️The indicator has all types of alerts.
✔️The indicator does not redraw.
✔️The algorithms of this indicator are unique and developed by their author
The Robust filter indicator is based on the robust filtering algorithm developed by the author using the multi-period averaged moving median.
The indicator calculates and shows:
✔️1. The direction of the trend;
✔️2. Entry and exit points of positions;
✔️3. StopLoss lines calculated from current price probability distributions and selected probability of closing an order by StopLoss before the trend reversal;
✔️4. Lot sizes based on the accepted risk level, deposit size and StopLoss position.
============================================================
✔️The indicator has all kinds of alerts.
✔️The indicator does not redraw.
✔️The indicator can be used both for trading scalper strategies and for long-term trading strategies.
Indicator is used for:
1. defining price probability distributions. This allows for a detailed representation of the channel and its borders and forecast the probability of a price appearing at each segment of its fluctuations;
2. defining the channel change moment.
✔️The algorithms of this indicator are unique and developed by their author
✔️ It has built-in management
The Quality trend indicator expresses the ratio of the strength of a trend or the speed of its growth (fall) to the degree of its noisiness or a certain norm of amplitudes of chaotic fluctuations of a growing (falling) price. The position of the indicator line above zero shows an increasing trend, below zero - a falling trend, the fluctuation of the indicator line near zero shows a flat.
If the indicator line begins to fluctuate rapidly around zero and approach it, then this indicates the imminent beginning of a trend movement. Quite often, an increase in the noise of even a rapidly growing trend or an increase in volatility indicates upcoming changes in the market, in particular, the end of the corresponding trend movement. Consequently, if the readings of an indicator with a high quality factor value suddenly start to decrease, then this indicates the imminent end of the corresponding trend movement. Therefore, the indicator readings are often leading and show the near end of a trend movement with a transition to a flat or even a change in the direction of the trend movement.
✔️The indicator does not lag behind and does not redraw.
El indicador de tendencia Calidad expresa la relación entre la fuerza de una tendencia o la velocidad de su crecimiento (caída) y el grado de su ruido o una cierta norma de amplitudes de fluctuaciones caóticas de un precio creciente (bajista). La posición de la línea del indicador por encima de cero muestra una tendencia creciente, por debajo de cero - una tendencia decreciente, la fluctuación de la línea del indicador cerca de cero muestra un plano. Si la línea del indicador comienza a fluctuar
The Strong Trend Flat Signal indicator is the intersection of two, developed by the author, non-lagging moving averages with averaging periods 21 and 63.
✔️The algorithms of this indicator are unique and developed by their author
The Quality trend indicator expresses the ratio of the strength of a trend or the speed of its growth (fall) to the degree of its noisiness or a certain norm of amplitudes of chaotic fluctuations of a growing (falling) price. The position of the indicator line above zero shows an increasing trend, below zero - a falling trend, the fluctuation of the indicator line near zero shows a flat.
If the indicator line begins to fluctuate rapidly around zero and approach it, then this indicates the imminent beginning of a trend movement. Quite often, an increase in the noise of even a rapidly growing trend or an increase in volatility indicates upcoming changes in the market, in particular, the end of the corresponding trend movement. Consequently, if the readings of an indicator with a high quality factor value suddenly start to decrease, then this indicates the imminent end of the corresponding trend movement. Therefore, the indicator readings are often leading and show the near end of a trend movement with a transition to a flat or even a change in the direction of the trend movement.
✔️The indicator does not lag behind and does not redraw.


