KT Bar Strength Index MT4
- Indicadores
-
KEENBASE SOFTWARE SOLUTIONS
 Keenbase Trading desarrolla indicadores profesionales y Asesores Expertos (Expert Advisors) para MetaTrader 4 y MetaTrader 5, diseñados para ayudar a los traders a tomar decisiones de trading más informadas.
 - Versión: 1.0
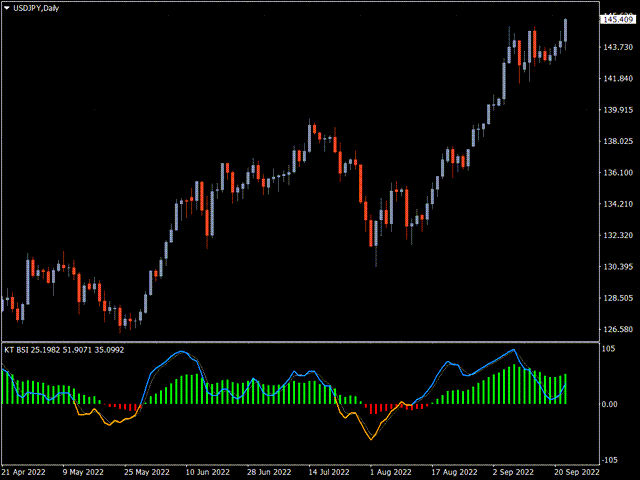
BSI son las siglas de Bar Strength Index (índice de fortaleza de la barra). Evalúa los datos de precios mediante un cálculo único. Muestra las lecturas en una ventana independiente.
Muchos inversores financieros confunden este indicador con el Índice de Fuerza Relativa (RSI), lo cual es incorrecto porque el BSI puede proporcionar una ventaja a través de su método de cálculo que el indicador RSI no ofrece.
El Bar Strength Index (BSI) se deriva del Internal Bar Strength (IBS), que se ha aplicado con éxito a muchos activos financieros como materias primas, acciones, índices y el mercado de criptomonedas en los últimos treinta años.
Los inversores pueden utilizar el IBS para vender posiciones en momentos de fortaleza y comprar posiciones en momentos de debilidad. Se basa en la siguiente fórmula
IBS = (cierre - mínimo) / (máximo - mínimo) * 100
Cómo operar con el BSI
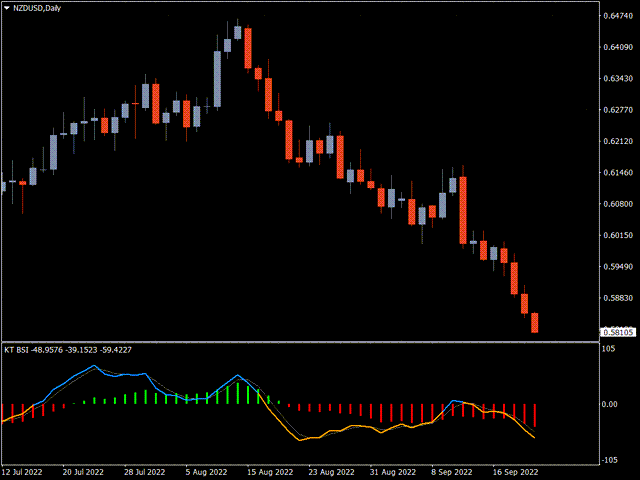
El BSI funciona mejor en marcos temporales altos, como el diario. Esto se debe a que tiene un nivel de zona verde superior y un nivel de zona roja inferior, que indican fuerza extrema y fuerza decreciente en el precio del activo, respectivamente.
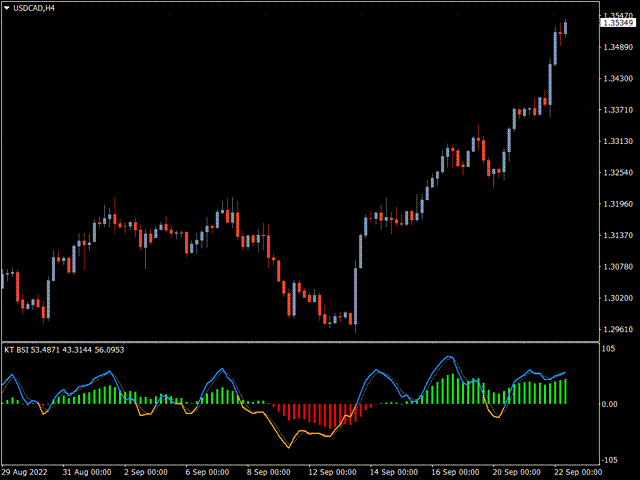
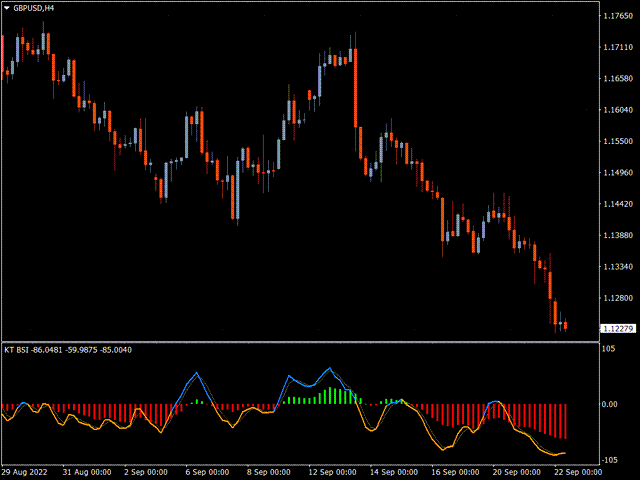
La línea dinámica BSI alcanza esos niveles en respuesta a las condiciones del mercado y a las acciones de los participantes. Este indicador puede utilizarse de forma independiente para generar ideas de negociación o junto con otros indicadores y herramientas técnicas para determinar las posiciones de negociación más prometedoras.
Algunos ejemplos de estrategias de negociación con BSI
Entrada de compra
- Los puntos parabólicos aparecen debajo de las velas de precios y comienzan a formar una serie.
- El indicador de volumen indica que el precio del activo está sometido a una creciente presión compradora.
- La línea dinámica BSI está en o cerca de la zona roja, lo que indica una falta de fuerza.
Salida de compra
- Al alza de las velas de precios, se activa el punto SAR parabólico.
- El indicador de volumen indica que aumenta la presión vendedora.
- La línea dinámica BSI cae en la zona roja, lo que indica que la fuerza disminuye después de alcanzar la zona verde.
Entrada de venta
- Los puntos parabólicos aparecen por encima de las velas de precios y comienzan a formar una serie.
- El indicador de volumen indica que el precio del activo está bajo una creciente presión de venta.
- La línea dinámica BSI se encuentra en la zona roja o cerca de ella, lo que indica falta de fuerza.
Salida de venta
- En la parte baja de las velas de precios, se activa el punto SAR parabólico.
- El indicador de volumen indica que aumenta la presión de compra.
- Después de alcanzar la zona verde, la línea dinámica BSI cae a la zona roja, lo que indica una disminución de la fuerza.