KT Bar Strength Index MT4
- 지표
-
KEENBASE SOFTWARE SOLUTIONS
 Keenbase Trading은 트레이더가 더욱 정확하고 신뢰할 수 있는 거래 결정을 내릴 수 있도록 MetaTrader 4 및 MetaTrader 5용 전문 지표와 Expert Advisor(EA)를 개발합니다.
당사의 제품은 실전에서 활용할 수 있는 거래 로직과 직관적인 사용자 경험을 결합하여 안정성, 사용 편의성, 그리고 체계적인 리스크 관리에 중점을 두고 설계되었습니다. 모든 도구는 철저한 테스트를 거쳐 실제 시장 환경에서도 일관되고 안정적인 성능을 제공할 수 있도록 개발됩니다. - 버전: 1.0
- 활성화: 10
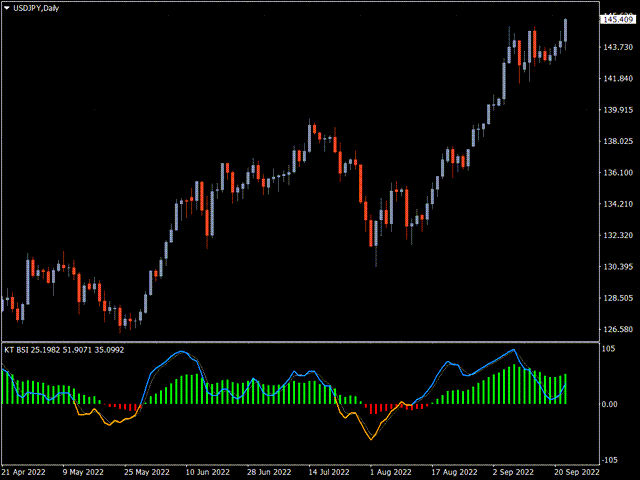
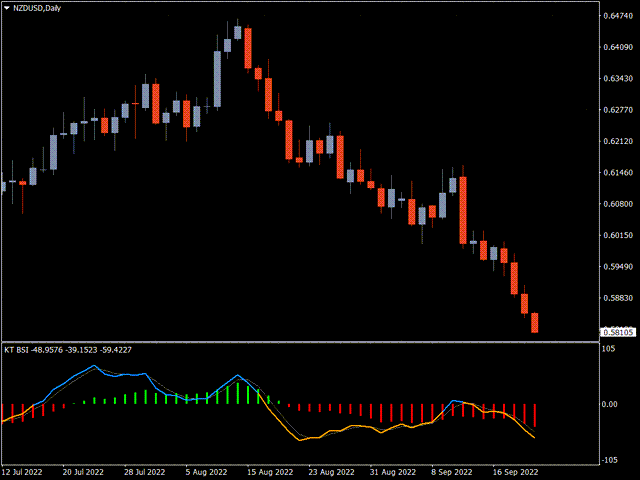
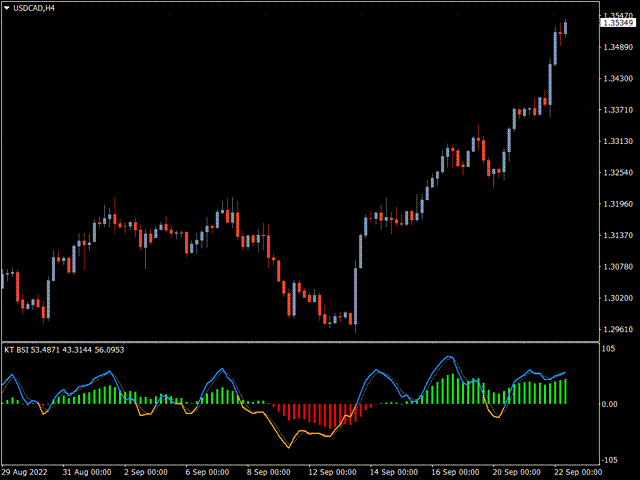
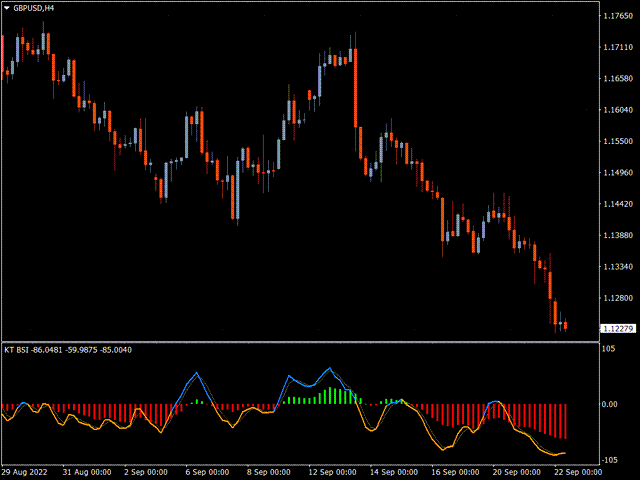
The BSI stands for Bar Strength Index. It evaluates price data using a unique calculation. It displays readings in a separate window.
Many financial investors mistake this indicator for the Relative Strength Index (RSI), which is incorrect because the BSI can provide an advantage through its calculation method that the RSI indicator does not.
The Bar Strength Index (BSI) is derived from the Internal Bar Strength (IBS), which has been successfully applied to many financial assets such as commodities, stocks, indices, and the crypto market over the last thirty years.
Investors can use the IBS to sell positions on strengths and buy positions on weaknesses. It's based on the following formula:
IBS = (close – low) / (high – low) * 100
How to trade using the BSI
BSI works best on higher time frames, such as daily. This is because it has an upper green zone level and a lower red zone level, which indicate extreme strength and decreasing strength in the asset price, respectively.
The BSI dynamic line reaches those levels in response to market conditions and participant actions. This indicator can be used independently to generate trade ideas or in conjunction with other technical indicators and tools to determine the most promising trading positions.
Some Examples of BSI Trading Strategies
Buy Entry
- Parabolic dots appear beneath price candles and begin to form a series.
- The volume indicator indicates that the asset price is under increasing buying pressure.
- The BSI dynamic line is in or near the red zone, indicating a lack of strength.
Buy Exit
- On the upside of price candles, the parabolic SAR dot activates.
- The volume indicator indicates that sell pressure is increasing.
- The BSI dynamic line drops in the red zone, indicating that strength decreases after reaching the green zone.
Sell Entry
- Parabolic dots appear above price candles and begin to form a series.
- The volume indicator indicates that the asset price is under increasing selling pressure.
- The BSI dynamic line is in or near the red zone, indicating a lack of strength.
Sell Exit
- On the downside of price candles, the parabolic SAR dot activates.
- The volume indicator indicates that buy pressure is increasing.
- After reaching the green zone, the BSI dynamic line drops into the red zone, indicating a decrease in strength.