Golden Limit
- Indicadores
-
Renato Fridschtein
 Software developer for over 35 years and trader for about 10 years, finally decided to combine the two to create robots to operate a unique method... And to learn more and more.
 - Versión: 2.11
- Actualizado: 7 agosto 2022
- Activaciones: 8
¡No hay límites!
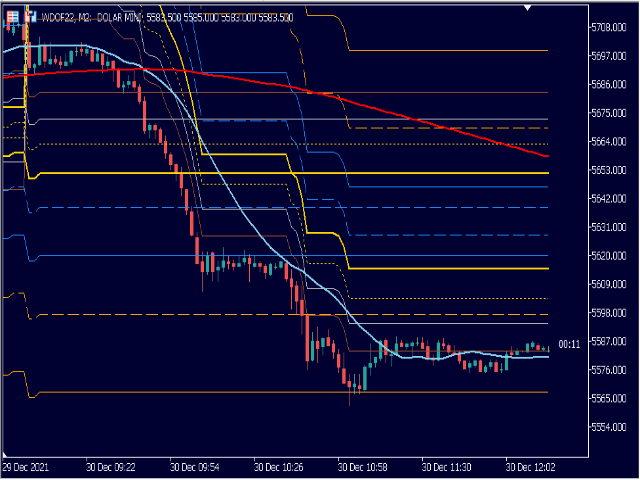
Golden Limit es el indicador definitivo para obtener lecturas claras y sencillas de los movimientos de los precios en los gráficos.
Proyecta rangos de soporte y resistencia, calculados por modelos estadísticos que involucran la Acción del Precio y la secuencia de Fibonacci, revelando de antemano el comportamiento de los precios y los mejores lugares para operar y no operar.
También cuenta con dos medias móviles para ayudar a elegir las mejores entradas.
El método Golden Limit fue creado a partir de un modelo probado. En resumen:
Utilizamos los nombres de los metales preciosos para los Límites para que el método sea más fácil de entender.
Cada día en la apertura, el indicador proyecta los límites iniciales de soporte y resistencia.
A continuación, el precio busca hacer un techo o un suelo cerca de uno de los dos primeros rangos proyectados: cobre o plata.
A continuación, el precio cambia de dirección y se dirige al límite dorado. Para algunos activos, esto sucede casi todos los días (más del 95%). De ahí el nombre del método.
A partir de ahí, el precio puede continuar hasta los siguientes límites o empezar a invertirse, yendo siempre de un límite a otro (no consecutivos).
Normalmente, este es el mayor/mejor movimiento que consiguen los precios en ese día.
Este comportamiento se observa en la mayoría de los símbolos y timeframes.
Parámetros
Recursos Activos:Haga doble clic sobre el valor para activar u ocultar el recurso.
Aviso Audible: un mensaje de audio que suena cuando se activa el indicador.
Soportes yResistencias: muestra los rangos límite de soporte y resistencia.
Medias móviles simples (SMA) de 20 y 200 periodos: seleccione NO para ocultar las medias.
Tiempo restante de la vela: Muestra el tiempo restante para que finalice la barra actual.
Ajustes Generales
Valor Inicial: Valor utilizado para el cálculo de Límites. Cada activo tiene su propio valor.*
Offset (1 a 10): Se utiliza para tiempos superiores a 10 minutos para ajustar los Límites.
Color Tiempo Restante: define el color que se utilizará para mostrar este recurso.
Arriba/Abajo Reinicio Semanal: SI hará los cálculos de límites en base a la semana en lugar del día. Sólo afecta a los tiempos de gráfico inferiores a una hora (H1).
Colores
El operador puede ajustar los colores y estilos de las líneas de límites y promedios como desee e incluso ocultar cada línea individualmente seleccionando Ninguno.
*NOTA: Contacte con nosotros para saber más sobre el Método Golden Limit .
Autor: Renato Fridschtein, desarrollador de software desde hace más de 35 años y trader desde hace más de 10. Lleva creando indicadores y robots de inversión desde 2020.