Three peaks or troughs MT5
- Indicadores
-
Dmitry Fedoseev
 Новый вариант эксперта exp_iCustom - exp_iCustomNew в маркете: https://www.mql5.com/ru/market/product/5660
 - Versión: 1.1
- Activaciones: 5
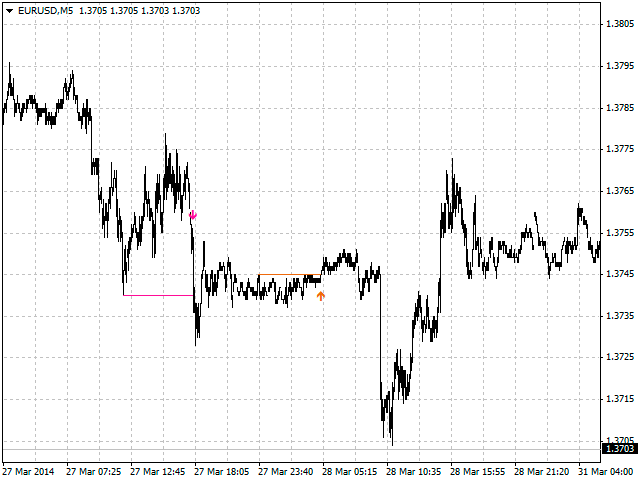
Un indicador de los patrones #50 y #51 ("Triple Bottoms", "Triple Tops") de Encyclopedia of Chart Patterns por Thomas N. Bulkowski.
Parámetros:
- Alertas - mostrar alerta cuando aparece una flecha
- Push - enviar una notificación push cuando aparece una flecha (requiere configuración en el terminal)
- PeriodBars - periodo del indicador
- K - un parámetro adicional que influye en la precisión del reconocimiento de la forma del patrón. Cuanto menor sea el valor, más suave será la fila de picos/valles, por lo que se reconocerán menos patrones
- ArrowType - un símbolo de 1 a 17
- DesplazamientoVFlecha - desplazamiento vertical de las flechas en píxeles
- ShowLevels - mostrar líneas en el nivel de ruptura
- ColUp - color de una línea ascendente
- ColDn - color de una línea descendente.
Nota. Las flechas aparecen en una barra de formación y no desaparecen.
No se puede garantizar que el indicador reconozca los patrones exactamente como lo implica el autor.
Parámetros de optimización recomendados: PeriodBars, K.