MACD Cross Prediction Indicator
- Indicadores
- Versión: 2.0
- Actualizado: 4 octubre 2019
- Activaciones: 10
El momento en que la línea MACD cruza la línea de señal suele provocar un movimiento significativo del precio y cambios de tendencia.
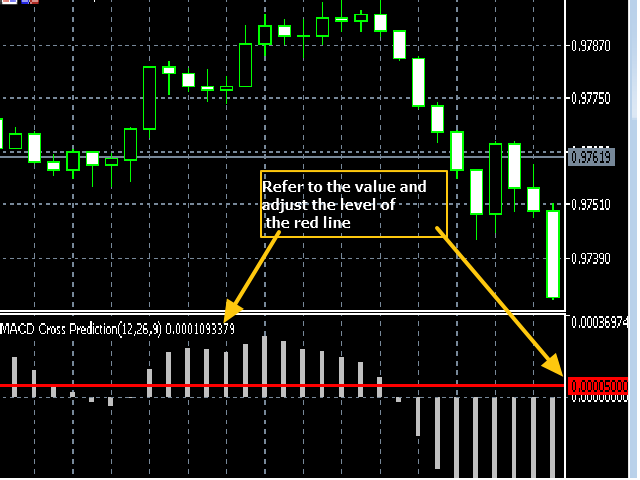
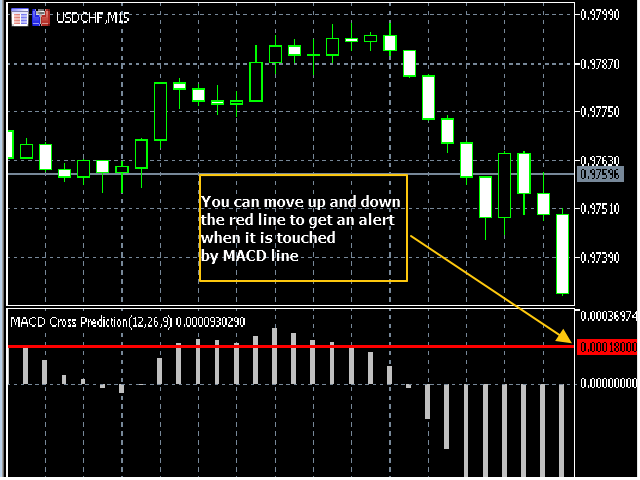
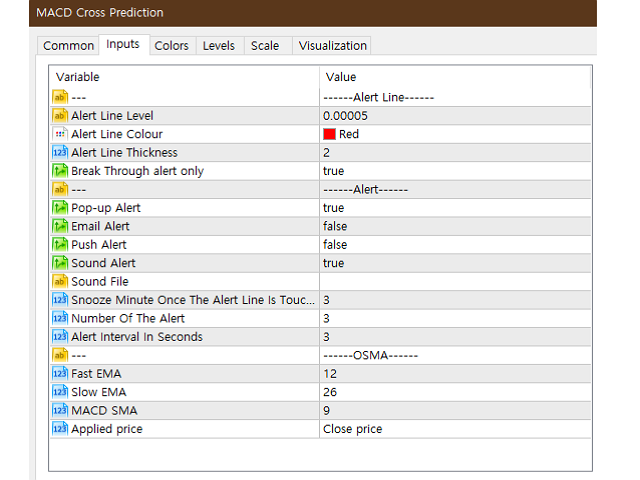
MACD Cross Prediction es un indicador que utiliza OSMA (oscilador MACD) y una línea roja. Puede cambiar el nivel de la línea roja en la ventana emergente de configuración del indicador (y la línea roja se mueve hacia arriba y hacia abajo). Las alertas (email, push móvil, sonido, alerta MT5) serán enviadas cuando el histograma MACD toque la línea roja, lo que significa que las alertas pueden ser enviadas justo antes/alrededor del momento en que la línea MACD cruce la línea de señal.
Este indicador funciona para todos los pares incluyendo Oro y Petróleo etc.....
----------------------------------------------------------------------------------------------
¿Qué es MACD(OSMA)?
MACD, abreviatura de moving average convergence/divergence (convergencia/divergencia de medias móviles), es un indicador comercial utilizado en el análisis técnico de los precios de las acciones, creado por Gerald Appel a finales de los años 70.[1] Está diseñado para revelar cambios en la fuerza, dirección, impulso y duración de una tendencia en el precio de una acción.
El indicador MACD (u "oscilador") es un conjunto de tres series temporales calculadas a partir de datos históricos de precios, la mayoría de las veces el precio de cierre. Estas tres series son: la serie MACD propiamente dicha, la serie "señal" o "media", y la serie "divergencia", que es la diferencia entre ambas. La serie MACD es la diferencia entre una media móvil exponencial (EMA) "rápida" (periodo corto) y una EMA "lenta" (periodo largo) de la serie de precios. La serie media es una EMA de la propia serie MACD.
Cruce de líneas de señal
Un "cruce de líneas de señal" se produce cuando las líneas MACD y media se cruzan; es decir, cuando la divergencia (el gráfico de barras) cambia de signo. La interpretación estándar de un evento de este tipo es una recomendación de compra si la línea MACD cruza al alza a través de la línea media (un cruce "alcista"), o de venta si cruza a la baja a través de la línea media (un cruce "bajista")[6]. Estos eventos se toman como indicaciones de que la tendencia de la acción está a punto de acelerarse en la dirección del cruce.
OsMA es la abreviatura del término oscilador de una media móvil (MA). El OsMA es un indicador técnico que muestra la diferencia entre un oscilador y su media móvil durante un periodo de tiempo determinado. El MACD es el oscilador más común utilizado en el indicato OsMA