Psychological or Round Levels
- Indicadores
-
William Jidekene Igwe
 Fell in love with trading after exchanging currency with my local bureau de change. Decided to look learn more about forex trading. Currently enjoying trading and in the future plan to combine machine learning with forex trading.
 - Versión: 1.0
- Activaciones: 7
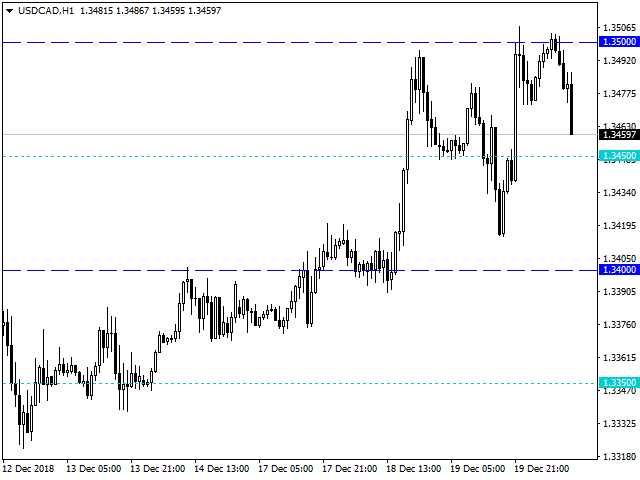
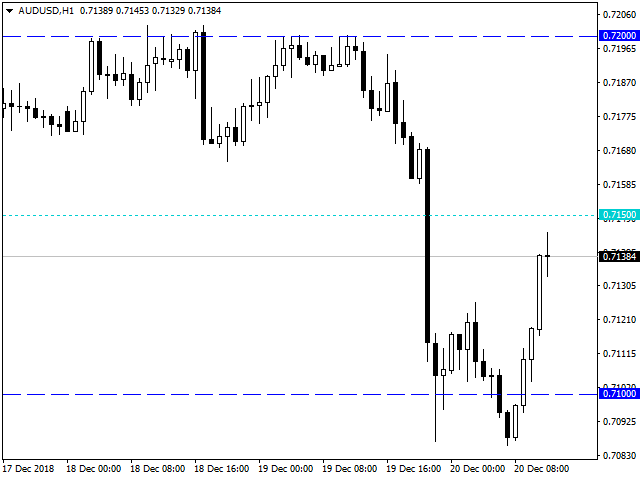
El indicador Niveles psicológicos o redondos dibuja automáticamente líneas o zonas en los niveles psicológicos (00 o 50) a medida que se mueve el mercado. Se dibujan nuevas líneas a medida que se mueve el mercado, mientras que las líneas antiguas se eliminan. De este modo, el gráfico queda despejado. El usuario especifica el número de líneas que prefiere en la charla, y el indicador mantiene constante el número de líneas. El indicador traza dos tipos de niveles, el Nivel Principal (00 niveles - p.ej. USDCAD 1.33000, 1.34000) y el Subnivel (50 niveles - p.ej. USDCAD 1.33500, 1.34500)
Características
- El usuario puede especificar el número de líneas preferidas en el chat
- Todas las líneas son totalmente personalizables, lo que le permite controlar cómo aparecen las líneas en el chat
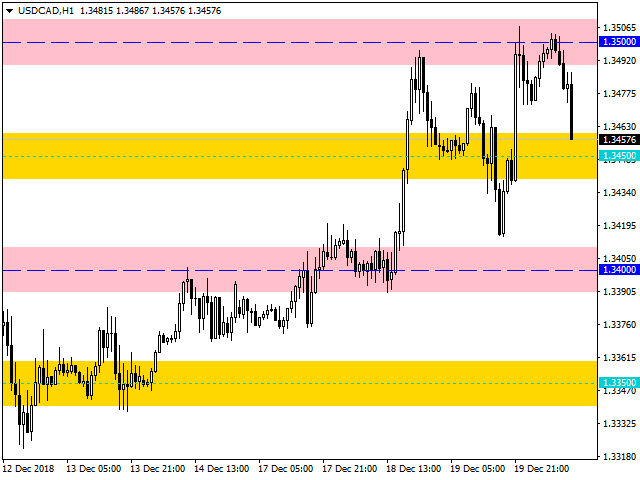
- Las líneas pueden cambiarse a zonas para los usuarios que prefieran ver los niveles de soporte y resistencia como zonas en lugar de líneas
- Las líneas se dibujan y borran automáticamente para ofrecer un gráfico limpio.
- Los usuarios pueden optar por ver tanto el Nivel Principal como el Subnivel en el chat o cualquiera de los dos niveles.
¿Qué son los niveles psicológicos?
Son números redondos o niveles (por ejemplo, EURUSD, 1,14000, 1,14500, 1,15000, etc.) a los que el mercado tiende a reaccionar. Eche un vistazo a cualquier gráfico y observará que el mercado tiende a reaccionar ante estos números redondos. Actúan como niveles naturales de soporte y resistencia. Como seres humanos, tendemos a pensar en términos de números redondos enteros, en lugar de en términos de números aleatorios. Los operadores institucionales suelen utilizar estos niveles cuando fijan sus niveles de beneficios o su precio de entrada. Además, los bancos centrales suelen utilizar estos números psicológicos como rango de referencia de precios para sus divisas. Esperan que sus divisas coticen dentro de este rango. Si el precio se acerca a estos números psicológicos, a menudo reaccionan verbal o real.
Estrategia
Mediante el uso de números redondos como soporte y resistencia, se puede operar, la ruptura, reversión o retroceso. Los niveles psicológicos combinados con el conocimiento de la acción del precio es una buena adición a la caja de herramientas de un técnico.
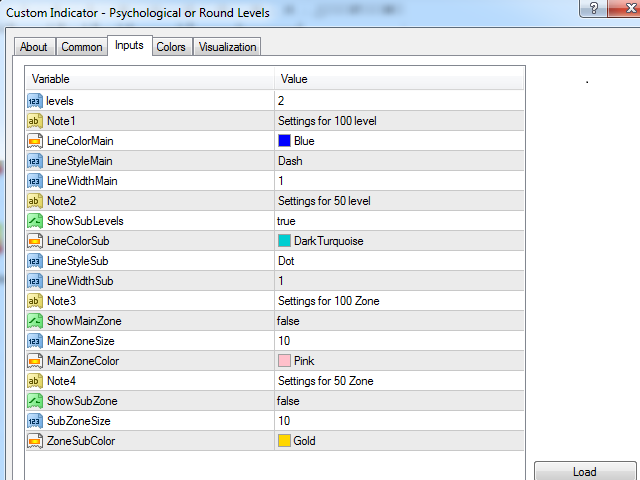
Parámetros de entrada
Los parámetros necesarios para el indicador se explican por sí mismos. Esta sección destaca algunos de los parámetros
- Niveles: Controla el número de líneas en el gráfico
- LineColorMain, LineStyleMain, LineWidthMain: Ajusta la propiedad de las líneas Main levels que es el nivel 00
- ShowSubLevels: para mostrar o no mostrar los Subniveles que es el nivel 50
- ShowMainZone: para los usuarios que prefieren utilizar zonas en lugar de líneas para indicar los niveles psicológicos
- SubZoneSize: controla el ancho de la zona permitiendo que la zona sea más ancha o más fina
Sobre el autor
William combina su amor por la programación y el trading en uno creando indicadores útiles tanto para traders nuevos como avanzados.