MASi MACD Histogram
- Indicadores
- Versión: 1.6
- Actualizado: 22 junio 2017

Este oscilador se ha convertido en una de las principales herramientas de la mayoría de los operadores profesionales.
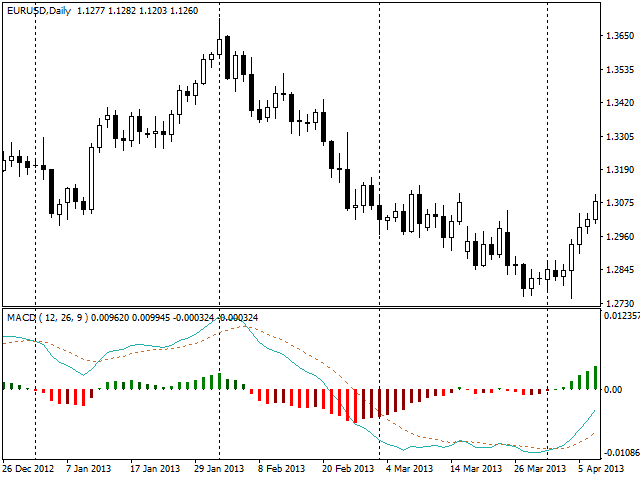
El indicador incluye una línea MACD(Moving Average Convergence/Divergence) clásica, una línea de señal, así como un histograma MACD.
En el cálculo se utilizan medias móviles exponenciales.
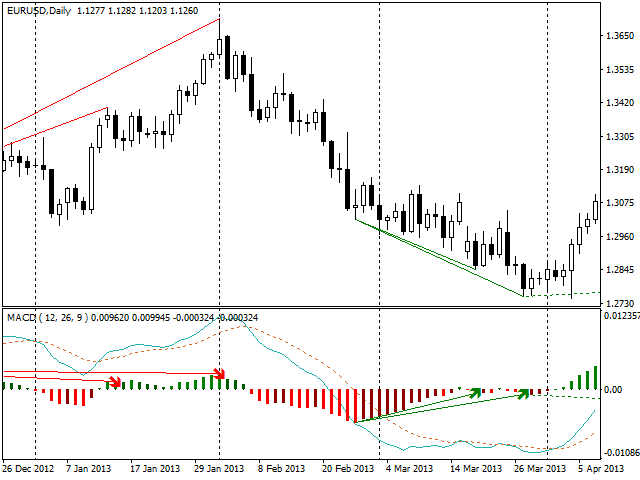
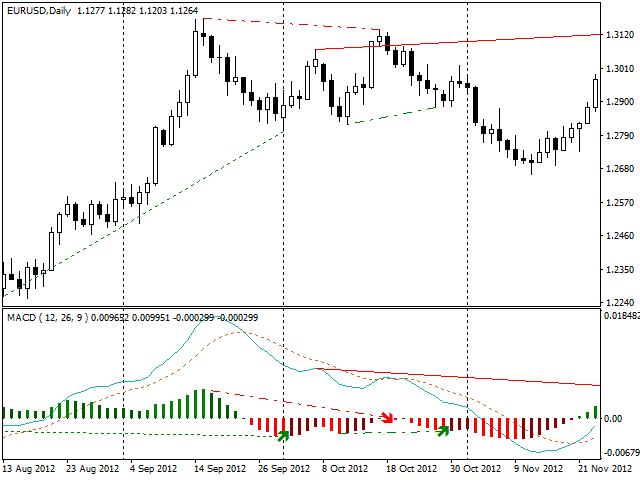
El indicador también ofrece la posibilidad de activar señales en la identificación de divergencias entre el gráfico de precios y el indicador. Las divergencias se identifican utilizando tres patrones: divergencias clásicas, ocultas y extendidas.
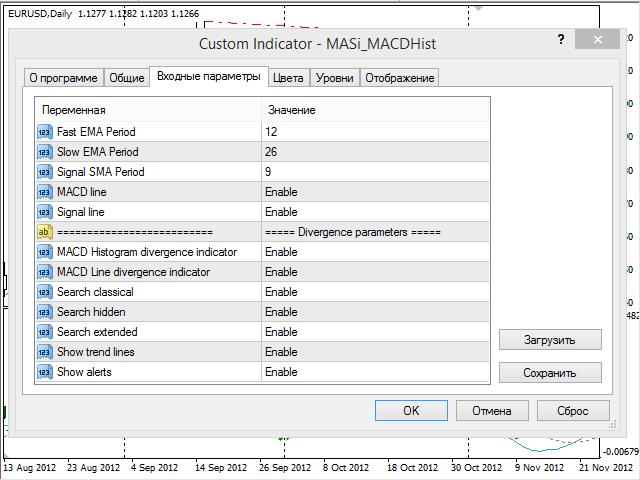
Parámetros del indicador
- Fast EMA Period - periodo de la media móvil exponencial rápida
- Periodo dela EMA lenta - periodo de la media móvil exponencial lenta
- Signal SMA Period - periodo de la media móvil exponencial de señal
- LíneaMACD - activa la visualización de la línea MACD
- Línea deseñal - activar la visualización de la línea de señal
Parámetros de divergencia
- MACD Histogram divergence indicator - habilita la búsqueda de divergencias utilizando el histograma
- Indicador de divergencia MACDLine - permite buscar divergencias utilizando la línea MACD
- Búsqueda clásica: habilita la búsqueda de divergencias clásicas.
- Búsquedaoculta - habilita la búsqueda de divergencias ocultas
- Búsquedaextendida - habilita la búsqueda de divergencias extendidas
- Mostrar líneas de tendencia - habilita la visualización de las líneas de tendencia de las divergencias
- Mostrar alertas - habilita las notificaciones cuando se encuentra una divergencia en las barras actuales


I like it , added to my main chart as second confirmation. Thank you