KT Trades Info MT4
- Indicadores
-
KEENBASE SOFTWARE SOLUTIONS
 Keenbase Trading desarrolla indicadores profesionales y Asesores Expertos (Expert Advisors) para MetaTrader 4 y MetaTrader 5, diseñados para ayudar a los traders a tomar decisiones de trading más informadas.
 - Versión: 1.0
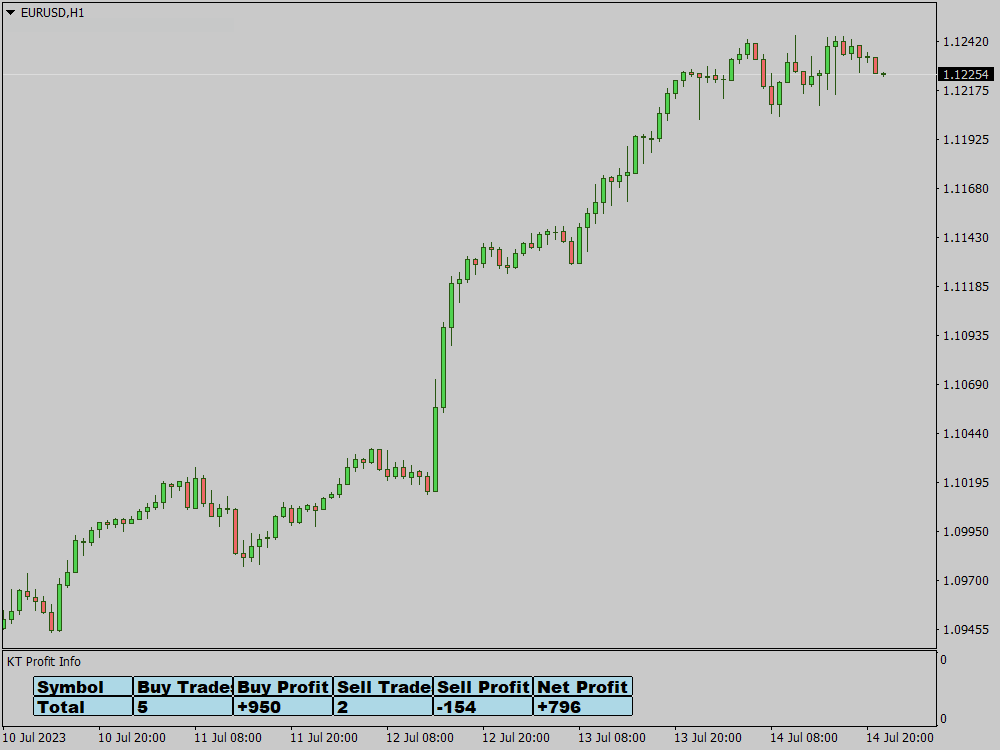
El indicador KT Trades Info es útil para los operadores que desean mantenerse informados sobre su rendimiento comercial. Este indicador proporciona actualizaciones en tiempo real sobre la rentabilidad de todas las operaciones en curso y completadas, lo que permite a los operadores tomar decisiones bien informadas. Al incorporar métricas financieras clave, proporciona una imagen completa de la situación financiera de un operador de un vistazo.
Esto significa que los operadores pueden supervisar su rendimiento con mayor exactitud y precisión, lo que facilita una mejor gestión del riesgo y planificación estratégica.
Características
- Cálculo de pérdidas y ganancias en tiempo real: Este indicador calcula continuamente el beneficio o la pérdida de las operaciones abiertas y cerradas, y el indicador muestra esta información en tiempo real.
- Métricas de rendimiento: Proporciona métricas clave como el beneficio bruto, la pérdida bruta, el beneficio neto, el número total de operaciones y las operaciones ganadoras y perdedoras.
- Porcentaje ganador: El indicador suele calcular el porcentaje de operaciones ganadoras frente al número total de operaciones, lo que indica claramente su tasa de éxito.
- Detalles de la operación: También se muestra información detallada sobre cada operación, incluido el precio de apertura de la operación, el precio de cierre, el tipo de operación (compra o venta) y el número de pips ganados o perdidos.
- Opciones de personalización: Los operadores pueden personalizar la visualización del indicador, incluida la ubicación en el gráfico, el tamaño de la fuente y el color del texto. Esto le permite adaptar el indicador a sus preferencias específicas.
- Conversión de divisas: El indicador puede convertir las cifras de pérdidas y ganancias a su divisa preferida para aquellos que operan en varias divisas.
Consejos profesionales
- Utilícelo como referencia de rendimiento para evaluar sus estrategias de negociación. Si sabe qué operaciones son rentables y cuáles no, podrá ajustar sus estrategias para mejorar el rendimiento general.
- Una tasa de ganancias elevada puede darle confianza en su estrategia de negociación, pero recuerde tener en cuenta la rentabilidad de cada operación. Unas pocas pérdidas grandes pueden compensar muchas pequeñas ganancias.
- Aproveche al máximo las opciones de personalización disponibles. Ajuste la configuración a sus preferencias para poder leer y comprender los datos con mayor eficacia. Una configuración adecuada puede ayudarle a evaluar rápidamente el rendimiento de sus operaciones.
- Mire más allá de los beneficios brutos. Analice el importe total de los beneficios netos y otras métricas para obtener una comprensión global de su rendimiento comercial. Unas ganancias brutas elevadas y unas pérdidas brutas elevadas podrían significar que su estrategia es de alto riesgo.
- Revise constantemente su rendimiento a lo largo del tiempo. Utilice los datos históricos para comparar su rendimiento comercial actual con el pasado. Esto le ayudará a identificar tendencias o cambios en sus hábitos de negociación.