Indicadores técnicos de pago para MetaTrader 4 - 29

El retroceso de Fibonacci es un método de análisis técnico para determinar los niveles de soporte y resistencia. El Indicador de Cadenas de Fibonacci TSO se diferencia de un simple indicador de Retrocesos de Fibonacci en que proporciona los objetivos para cada nivel de retroceso. En otras palabras, hay un nivel de extensión (D) para cada nivel de retroceso (C). Además, si se alcanza un nivel de extensión, se crea automáticamente una nueva configuración de Fibonacci. Estas configuraciones Fibonac

Una versión visualmente simplificada del RSI. El Índice de Fuerza Relativa (RSI) es un conocido oscilador de impulso que mide la velocidad y el cambio de los movimientos de los precios, desarrollado por J. Welles Wilder. Se utilizan barras codificadas por colores para leer rápidamente el valor y el historial del RSI.
Características Encuentre situaciones de sobrecompra y sobreventa de un vistazo. El indicador no se repinta. El indicador se puede utilizar fácilmente como parte de un EA. (ver más

Este indicador se basa en indicadores CCIs y está totalmente automatizado. Línea muestra la línea de tendencia por CCIs. Este indicador calcula CCIs de Todos los plazos y muestra la línea actual en cada plazo. Puede utilizarlo en cualquier marco de tiempo que desee, la línea de tendencia se calcula para este marco de tiempo. Los ajustes no son necesarios. Pruébelo en la cuenta Demo antes de la cuenta real. Operar es arriesgado. Usted negocia en su propio riesgo.

O CKC.
Este indicador funciona según la regla clásica de la media móvil de diez días descrita por Chester W. Keltner (1909-1998). Todos los parámetros están configurados en la versión clásica del sistema Keltner por defecto, mientras que el usuario puede cambiarlos si lo desea. Información importante
Lea el manual de CKC: https://www.mql5.com/en/blogs/post/736577 Ejemplo de asesor experto de CKC: https://www.mql5.com/en/blogs/post/734150
Acerca de la fórmula del canal Keltner
1. Calcule la lín

El indicador Envelopes determina la presencia de una tendencia o plana. Tiene 3 tipos de señales, muestra los niveles probables de retroceso y los niveles de los posibles objetivos. En los cálculos del indicador se utilizan los coeficientes de Fibonacci. Señales (se generan al tocar las líneas o al rebotar desde las líneas): Tendencia - la línea media de la Envolvente tiene una inclinación marcada; las líneas por debajo de la línea media del canal se utilizan para operaciones de compra, las líne

Este es un indicador oscilatorio que tiene sólo dos líneas: Línea Principal - El cálculo para este valor se basa en los precios de apertura, máximo, mínimo y cierre de los parámetros de entrada elegidos (dentro de los períodos establecidos). Línea de Señal - El cálculo para la línea de señal se basa en la suma (& multiplicación) de varios promedios móviles de los Períodos Padre, Hijo y Espíritu Santo (todos aplicados al valor de la línea principal).
Parámetros de entrada Tenga en cuenta que, a

Se trata de un indicador de seguimiento de tendencias que identifica puntos de entrada óptimos en la dirección de una tendencia con un stop loss objetivo para gestionar la operación. El indicador le permite captar la tendencia a tiempo y seguirla. El indicador traza una línea de resistencia cuando detecta una tendencia alcista y una línea de soporte cuando detecta una tendencia bajista en el gráfico. Cuando se rompen esos niveles, le permite identificar la dirección de la tendencia y el impulso

Este PowerSignal es un sistema comercial completo basado en ATR de indicadores técnicos. Estos indicadores registrarán el estado actual de cada POWERTREND en cada marco de tiempo y par de divisas analizados. El PowerSignal crea una visualización de la lista de señales de punto de entrada y fuerza de tendencia mediante la evaluación de estos datos. Si hay una coincidencia total en cualquier par, aparecerá una alerta indicando tal caso. Los datos de la lista incluyen Símbolo, M5-MN1, BuyPercent,

Este indicador muestra los movimientos de la tendencia.
Parámetros Tendencia: Muestra los movimientos de la tendencia, verdadero/falso. X: mueve la tendencia a izquierda y derecha. Y: mueve la tendencia arriba y abajo. Cómo entender el estado: (M1), el cuadrado indica el marco temporal de 1 minuto. Si el cuadrado es verde, la tendencia es alcista. Si el cuadrado es rojo, la tendencia es bajista. (M5), el cuadrado indica el marco temporal de 5 minutos. Si el cuadrado es verde, la tendencia es al

El indicador YFX Symbol Selector se utiliza para cambiar fácilmente el símbolo y el periodo del gráfico con sólo pulsar un botón. Para ello se utiliza un objeto GUI selector que puede colocarse en cualquier esquina del gráfico. El selector GUI contiene la siguiente información: Cabecera descriptiva del panel selector GUI Información del símbolo y controles para cambiar el símbolo del gráfico Información sobre el periodo y controles para cambiar el periodo del gráfico Pie de página con la cotizac

El indicador EuroSession combina el filtrado por un MACD modificado y un indicador basado en la tendencia. Es un indicador que intenta captar el movimiento temprano del mercado de la sesión europea. Esto significa que las órdenes pendientes deben colocarse mucho antes de este movimiento. BUY Las órdenes pendientes (Buystop) deben ser colocadas si: La tendencia muestra un sesgo alcista El MACD muestra un sesgo "relativamente alcista". VENTA Las órdenes pendientes (Sellstop) deben colocarse si: La
El indicador ExchangeZone muestra en el gráfico de cotizaciones el horario de funcionamiento de las bolsas de todo el mundo. Muestra las bolsas de valores que operan en ese momento. El objetivo del indicador es ayudar al operador a prepararse para la próxima operación. Este indicador se puede utilizar para analizar la volatilidad en un gráfico histórico en el momento del trabajo de diferentes bolsas. Este análisis permite predecir la dinámica del mercado y tomar las decisiones adecuadas de compr

El indicador 'OHLC Moving MTF Average ' proviene de la antigua estrategia 'Moving Average ' con señales disponibles. Hay muchos ajustes disponibles para personalizar exactamente cómo le gustaría inventar su propia media móvil algo. Una acción personalizable avanzada media móvil de reemplazo y también viene con una estrategia de señal de colores negociables.
Configuración predeterminada ; utilizando cálculos personalizados OHLC media móvil; genera tendencias no repintado & scalping señales.
Car
Los puntos pivote son líneas prominentes que se basan en el propio curso para determinar posibles soportes y resistencias. Lamentablemente, existe más de un método para calcularlos. Teniendo en cuenta los diferentes puntos pivote, (por ejemplo, los pivotes de Fibonacci) se pueden ver algunos puntos en común en algunos precios. En este caso se pueden ver mejor las posibles zonas de soporte y resistencia. Este indicador le permite ver estas zonas. Le muestra los puntos de pivote con cálculo clásic
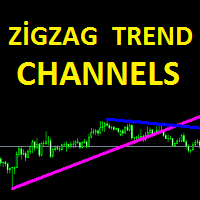
El indicador ZigZag Trend Channels está diseñado para encontrar tendencias de canal. Este indicador utiliza el indicador de zigzag, algunas líneas de canal y algunos algoritmos. Este indicador también envía avisos de señales para procesar puntos de entrada. Formaciones de tendencias alcistas, bajistas y triangulares. Fácil de usar y comprensible. Las líneas de canal aparecen en la pantalla y las formas de tendencia están escritas.
Sugerencias y Características Este indicador tiene 3 característ

Zip Arrow es un indicador original con capacidad de personalización flexible. Cada usuario podrá personalizarlo según el estilo de negociación y el par de divisas. El indicador no cambia sus valores, tiene un filtro que permite mostrar la señal sólo en la dirección de la tendencia principal.
Parámetros del indicador TPeriod - ajuste del filtro de tendencia. Cuando el valor aumenta, las señales se mostrarán sólo en la dirección de la tendencia principal. Se recomienda fijar el valor por encima d

Determinar la tendencia actual es una de las tareas más importantes de una operación, independientemente del estilo de negociación. El indicador Atom Trend puede ayudar a hacerlo con una probabilidad bastante alta. Atom Trend es un indicador de reconocimiento de tendencia, que utiliza un algoritmo de cálculo original. Se puede utilizar en cualquier par de divisas y cada marco de tiempo. No cambia sus valores. El volumen de ticks también se puede utilizar en los cálculos como un filtro adicional.

Determinar la tendencia actual es una de las tareas más importantes de una operación, independientemente del estilo de negociación. El indicador Quantum Trend Volume puede ayudar a hacerlo con una probabilidad bastante alta. Quantum Trend Volume es un indicador de reconocimiento de tendencia, que utiliza un algoritmo de cálculo original. No cambia sus lecturas bajo ninguna circunstancia. Los volúmenes de tick se utilizan como un filtro adicional. Se puede utilizar en cualquier par de divisas y c

Break Moment es un indicador propietario único con amplias capacidades y una gran variedad de ajustes. Puede utilizarse como generador de señales o como herramienta auxiliar. Para los cálculos, se determina el canal de precios. Cuando se rompe, si se cumplen todas las condiciones del filtro adicional, muestra una señal en forma de histograma. Break Moment puede utilizarse para determinar la tendencia principal, ya que dispone de 2 filtros para determinarla además de todo lo demás. Si estos filtr

El indicador no repinta los niveles de soporte y resistencia. Muestra el cambio porcentual diario, semanal y mensual del cierre anterior con respecto al precio real. Funciona bien para Forex, índices y futuros.
Ajustes Time Frame - seleccione D1, W1 o MN. Historia - número de historia para mostrar los niveles de un período elegido. Niveles - número de niveles actuales para mostrar un período elegido. Valor de niveles % - porcentaje de diferencia entre un nivel y otro. Open color - color de aper

El indicador estocástico de barras de tendencia es la versión modificada del indicador estocástico estándar. Este indicador es diferente del indicador estocástico estándar y se convirtió en un indicador de barras de tendencia. Mayor visibilidad para entender las tendencias. Fácil de usar y sencillo. El usuario detectará fácilmente las tendencias. Puede utilizar este indicador como indicador de tendencia por sí solo. O como filtro de tendencias junto con otros indicadores estratégicamente relevan

Dynamic Levels es un indicador de canal de niveles dinámicos, diseñado para la identificación de los extremos del precio. Permite aumentar la eficiencia de cualquier estrategia debido a los parámetros avanzados, que a su vez permiten personalizarlo para el estilo de negociación personal. Niveles Dinámicos no cambia sus valores, es adecuado para cualquier marco de tiempo y par de divisas.
Parámetros del Indicador ChannelPeriod - periodo para el cálculo del indicador. ChannelSmoot - suavizado de

Determinar la tendencia actual es una de las tareas más importantes para un operador, independientemente de su estilo de negociación. Trend Scan es capaz de definir una tendencia con una precisión bastante alta. El indicador aplica el método propietario en sus cálculos. Trend Scan es adecuado para cualquier par de divisas y marco temporal. No cambia sus lecturas. El indicador tiene en cuenta las lecturas de volumen y volatilidad, las combina y muestra el resultado como un histograma. El color de
Determinar la tendencia actual es una de las tareas más importantes para un operador, independientemente de su estilo de negociación. Price Direction es capaz de definir una tendencia con una precisión bastante alta. El indicador aplica el método propietario en sus cálculos. Price Direction es adecuado para cualquier par de divisas y marco temporal. No cambia sus lecturas. El indicador se basa en la volatilidad y el método único. El color del histograma depende de la fuerza de la tendencia actua

Forex Gump es un sistema de negociación semiautomático totalmente acabado. En forma de flechas, las señales se muestran en la pantalla para la apertura y cierre de operaciones. Todo lo que necesita es seguir las instrucciones del indicador. Cuando el indicador muestra una flecha azul, es necesario abrir una orden de compra. Cuando el indicador muestra una flecha roja, es necesario abrir una orden de venta. Cierre las órdenes cuando el indicador dibuje una cruz amarilla. Para obtener el resultado
MACD (Moving Average Convergence/Divergence) es un indicador clásico utilizado en el análisis técnico desde finales de la década de 1970. Se supone que revela los cambios en la fuerza, la dirección, el impulso y la duración del precio de las divisas de una tendencia (también acciones, materias primas, etc.). El Nuevo indicador MACD es un modelo avanzado del indicador MACD estándar. Puede utilizar el Nuevo MACD absolutamente de la misma manera que el clásico. La principal diferencia es que el Nue
Este indicador determina el tamaño medio de la cuenca (cuerpo, mechas) para la gama especificada.
Parámetros de entrada Modo - seleccione el modo del indicador: HighLow - el indicador calcula el tamaño promedio de la barra de High a Low y muestra los datos en forma de histograma en la parte inferior de la terminal. OpenClose - el indicador calcula el tamaño medio de la barra desde Open hasta Close y muestra los datos en forma de histograma en la parte inferior del terminal. HLOC - el indicador

El indicador es una buena herramienta para el scalping. Los puntos de entrada se definen utilizando indicadores auxiliares, como el estocástico y la media móvil simple. El indicador está representado por flechas que muestran la dirección probable del mercado. La señal aparece justo después del cierre de la vela actual.
Parámetros recomendados: Par de divisas - cualquiera; Marco de tiempo - no menos de М5.
Parámetros Tamaño de la etiqueta del indicador - tamaño de la etiqueta gráfica; La posició

El indicador identifica tendencias y microtendencias, perfectamente adecuado para quienes prefieren el scalping. Se ha desarrollado para trabajar en el marco temporal M1, aunque también muestra tendencias claras en los marcos temporales superiores para posiciones a largo plazo. El indicador no se redibuja. Los datos históricos de los gráficos y los precios se utilizan para la indicación. Esta es la base del indicador. Si el precio está en el canal azul, la tendencia es alcista. Si el precio está

El indicador calcula el precio del instrumento de negociación basándose en el nivel porcentual del RSI. El cálculo se realiza por precios de Cierre, por lo que podemos averiguar rápidamente el precio, en el que el RSI muestra el nivel de porcentaje especificado. Esto le permite colocar preliminarmente niveles de stop (Stop Loss y Take Profit) y órdenes pendientes de acuerdo con puntos significativos del RSI con mayor precisión. El indicador muestra claramente que los niveles de RSI cambian const
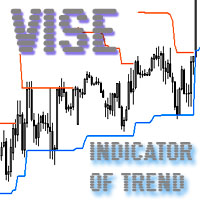
Vise es un indicador de tendencia. Las líneas superior e inferior siguen al precio mostrando la dirección predominante del precio. Las rupturas frecuentes de la línea superior indican una tendencia alcista, mientras que las rupturas frecuentes de la línea inferior indican una tendencia bajista.
Parámetros Puntos para UpLine - número inicial de puntos para la línea superior; Puntos para DownLine - número inicial de puntos para la línea inferior. Durante la ruptura del nivel superior (línea), est
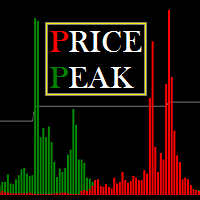
Price Peak está diseñado para buscar extremos, lugares donde es probable que el precio se invierta y la tendencia actual cambie a la contraria. El indicador es adecuado para cualquier par de divisas. Sin embargo, para que los valores del indicador se muestren adecuadamente, es necesario tener suficientes datos históricos para el marco temporal al que se adjunta el indicador. Se recomienda adjuntar Price Peak en los marcos de tiempo de M1 a D1. Sus cálculos utilizan 7 métodos, que se seleccionan

Ozi Arrow es un indicador único que puede mostrar señales en la dirección de la tendencia principal y señales contra tendencia. Para los cálculos, el indicador determina un canal de precios. Si recientemente el precio estuvo en sus fronteras, y se observan todas las condiciones de los filtros adicionales, se muestra una señal en forma de flechas. Ozi Arrow es adecuado para cualquier marco de tiempo y cualquier par. Las señales del indicador no desaparecen bajo ninguna condición. Una característi
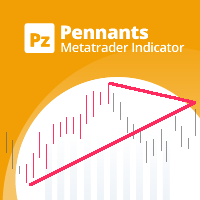
Este indicador encuentra banderines , que son patrones de continuación identificados por líneas de tendencia convergentes que rodean un período de consolidación de precios. Las operaciones se señalan utilizando un período de ruptura junto con la ruptura de la formación. [ Guía de instalación | Guía de actualización | Solución de problemas | FAQ | Todos los productos ] Fácil de usar Colores y tamaños personalizables. Implementa señales de arranque Implementa alertas de todo tipo.
Uso óptimo Par

¡Tan increíblemente útil, una vez que lo use se preguntará por qué no está integrado en MT4! El más avanzado indicador de cuenta atrás de velas y alerta de temporizador personalizado para MetaTrader 4. Todas las estrategias de trading exitosas tienen una cosa en común: todas se basan en el cierre de una vela antes de decidir qué acción tomar. Acción, reacción. Desafortunadamente, en MetaTrader 4, a menos que tenga los ojos pegados a la pantalla 24/5, es muy fácil perder increíbles oportunidades

Algo Mtf es un indicador multi timeframe que puede informarle sobre la situación de los indicadores colocados en otros timeframes. Este indicador tiene la posibilidad de ofrecer una serie de cálculos algorítmicos tales como: RSI, Vortex, MACD, Momentum, Stocastic y ATR. Las zonas están coloreadas en base a los niveles de estos indicadores en el timeframe elegido.
La observación de la confluencia ofrece excelentes consejos operativos y permite identificar la tendencia. El indicador es muy eficien
Este indicador está basado en el conocido indicador de Bandas de Bollinger y facilita el manejo de BB. Permite dibujar hasta 3 canales de Bollinger y por lo tanto simplifica la navegación en la lista de indicadores. También permite trazar las Bandas de Bollinger de diferentes marcos de tiempo, por ejemplo: dibujar BB en el marco de tiempo M5 con los parámetros: Período = 100, Timeframe = H1.
Entradas Valor Modo - elegir diferentes modos de trabajo con el indicador StaticTimeFrame - el indicador

Triton Arrow es un indicador de autor único que tiene la capacidad de mostrar 3 tipos de señales. Aparecen en la dirección de la tendencia actual, y en contra de ella, así como en un cierto exceso de volatilidad. Triton Arrow es adecuado para cualquier marco de tiempo, par de divisas. Las señales del indicador no desaparecen bajo ninguna condición. Se recomiendan los marcos temporales M5, M15.
Parámetros del indicador
Parámetros principales: CounterTrendPeriod - período para calcular las señale
Scalper X indicador es muy simple pero potente indicador. Este es un indicador muy útil, combinado con un panel para el comercio rápido le dará muchas satisfacciones. Este indicador se puede utilizar en cualquier par de divisas y en cualquier marco de tiempo, Se adapta a cada velocidad de negociación. Por otra parte, es relativamente fácil de operar con Scalper X Indicador. Este indicador produce dos señales: Señal de COMPRA: flecha aqua Señal de VENTA: flecha roja
Parámetros del indicador Sign
DStochastic es una versión mejorada del oscilador estocástico clásico con una media móvil añadida. El indicador amortigua el ruido del mercado, determina su dirección y reduce el número de señales falsas. También hemos añadido una función de visualización multicolor de la línea de señal de subida y bajada mediante puntos. Los puntos azules indican el desarrollo de una tendencia ascendente, los puntos rojos - descendente. Al igual que todos los osciladores estándar, DStochastic se puede combinar
El indicador funciona en dos direcciones: profit y drawdown , así como en dos dimensiones: % y $. Si se fija el valor de $ , el % se ajusta automáticamente a $ . Cuando el depósito cambia, el propio indicador ajusta los niveles en relación a lo que se fijó, y el otro parámetro se ajusta al primero. La corrección aparece cuando cambia el depósito. Redondeo de los números en coma flotante en las líneas (para una mejor legibilidad) en valor dólar - 2, en porcentaje - 1. Los niveles se fijan automát

Best and worst Dashboard nació de la idea de tener un panel que incluyera todos los símbolos de un gráfico. Es muy importante entender qué símbolos son positivos y negativos. En el pasado, nos dimos cuenta de que el único indicador Best and Worst (https://www.mql5.com/en/market/product/11784) , ahora gracias a la actualización de la Metatrader el tablero de instrumentos muestra todos los instrumentos de forma simultánea. Una gran revolución. Este Dashboard es capaz de calcular el rendimiento en

Este indicador es la continuación lógica del conocido indicador de canal equidistante: https://www.mql5.com/en/market/product/8723. El objetivo principal del indicador es la visualización de los niveles de precios relativos al canal paralelo utilizando los niveles de Fibo Bobokus en una ventana separada y el historial de precios. Esto a menudo permite pronosticar el movimiento futuro del precio con un grado suficientemente alto de probabilidad. La ecuación de cálculo de los niveles Fibo es la si

El oscilador estocástico es un indicador de impulso que utiliza niveles de soporte y resistencia. El término "estocástico" se refiere al punto de un precio actual en relación con su rango de precios durante un período de tiempo. Puede utilizar un Nuevo Estocástico de la misma manera que uno clásico: Zonas de sobrecompra y sobreventa para realizar órdenes de compra o venta. Este nuevo indicador muestra toda la variedad de Niveles Fibonacci (desde 23.6 hasta 76.4) que pueden ser usados como nivele

Leo Trend es un indicador de señales que muestra los puntos de entrada en el mercado, así como la dirección de la tendencia y el plano en el gráfico en forma de flechas y líneas. Leo Trend será útil tanto para los principiantes que creen una estrategia de negociación, como para los profesionales que lo integren en sistemas de negociación ya creados. Leo Trend funciona sin redibujar y sin retrasos significativos. El funcionamiento del indicador se muestra en el vídeo. Además, puede probar este in

Volume Analysis Trader observa el volumen utilizando una media fija de volumen. Esta media ayuda a detectar cuándo el volumen está subiendo o bajando. También he añadido picos de volumen, que es cuando el volumen de repente está por encima de la media. Esto ayuda a detectar los retrocesos del mercado. Esto ayudará a un operador a buscar lo siguiente en sus operaciones: El aumento de volumen durante un rally muestra que la tendencia es fuerte. La caída del volumen durante una subida indica que la

Versión MetaTrader 5 disponible aquí: https://www.mql5.com/en/market/product/24882 FFx Basket Scanner es una herramienta global que escanea todos los pares y todos los plazos sobre hasta cinco indicadores entre los 16 disponibles. Verá claramente qué divisas debe evitar negociar y en cuáles debe centrarse.
Una vez que una divisa entra en una zona extrema (por ejemplo, 20/80%), puede operar con toda la cesta con gran confianza. Otra forma de utilizarlo es observar dos divisas (débil frente a fue

CME Daily Bullettin Open Interest proporciona los datos sobre el interés abierto de los contratos de futuros en el CME para sus gráficos. El interés abierto es un tipo especial de volumen, que muestra cuántos contratos están en manos de los participantes del mercado en cada momento. Este tipo de información sólo está disponible en los mercados de futuros. Pero ahora, con este indicador, también puede analizar estos datos cuando opere en los mercados al contado, como FOREX. Además, el indicador p
Plotter es un indicador que se creó durante la tutoría ICT para que la creación de gráficos sea rápida, fácil y divertida para todos. Asigne una función a cualquier tecla de acceso rápido en la configuración del indicador o utilice las teclas predeterminadas para realizar acciones inteligentes que normalmente llevan mucho tiempo. Haga clic en cualquier barra, pulse OHLCMBVPOKJH para trazar objetos, colorearlos con las teclas 0-9 o modificarlos con las teclas ERAZ y mucho más. A continuación se d

Indicador de cambio de tendencia. Este indicador se basa en el valor esperado, así como en los indicadores técnicos Bandas de Bollinger e Ichimoku Kinko Hyo. Una inversión de tendencia se determina mediante una fórmula matemática compleja, y su confirmación se basa en los valores de BB y la nube Ichimoku. Las señales se generan en el pico de una inversión de tendencia, es decir, Trend Arrow Finder identifica el comienzo de una nueva tendencia y el final de la tendencia anterior. Cuando se abre u
El indicador Roll está diseñado para encontrar extremos locales y determinar la tendencia actual. El indicador se basa en los valores de volumen y volatilidad. El cálculo del indicador puede modificarse activando el parámetro Modificación y eligiendo una de las opciones de cálculo disponibles en CalcMode . Para poder determinar la tendencia actual utilizando este indicador, debe aumentar el valor del parámetro OsPeriod y disminuir los valores de DynamicLevelPeriod y ShiftDynamicLevel . El indica
Double Wave aplica indicadores estándar, volatilidad, volumen y una serie de enfoques personalizados que permiten combinar eficazmente todas las herramientas mencionadas. El indicador permite definir posibles puntos de inversión del precio tanto en la dirección de una tendencia (preferible) como en contra de ella. Además, el indicador ayuda a determinar la tendencia y la visualiza mediante un histograma. El indicador funciona con cualquier símbolo siempre que se disponga de datos históricos sufi

Instrucciones Adjunte el indicador a cualquier gráfico (se aconseja H4) Utilice las pestañas de entrada (por defecto son 5 y falso ) Pulse ok y continúe operando.
Descripción El indicador utiliza un tipo de estrategia de ruptura de patrón para ayudar a su estrategia de negociación. Estoy utilizando esta estrategia en gráficos H4 para muchos de los pares con un trailing stop y la configuración predeterminada del indicador. Los mejores resultados se muestran en USDJPY, EURJPY, CADJPY, EURGBP, EUR
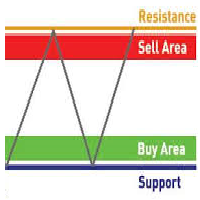
Este es un Indicador de Múltiples Marcos de Tiempo y Múltiples Pares de Divisas (Tablero de Puntuación ) que muestra los Niveles de Soporte y Resistencia de todos los TFs para 15 pares de divisas a su elección. La terminología de soporte se refiere a los precios en un gráfico que tienden a actuar como un piso al evitar que el precio de un activo sea empujado hacia abajo y puede ser una buena oportunidad de compra porque esta es generalmente el área donde los participantes del mercado ven un buen

Este indicador implementa un proceso de suavizado lineal simple.
Una de las desventajas del suavizado exponencial es el rápido decaimiento de la señal. Esto hace que sea imposible realizar un seguimiento completo de las tendencias a largo plazo en el rango de precios. El suavizado lineal le permite ajustar con mayor precisión y precisión el filtrado de la señal.
El indicador se configura seleccionando parámetros:
LP: este parámetro le permite seleccionar el período de suavizado. Cuanto mayor
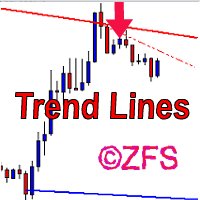
El indicador dibuja canales. El movimiento estimado del precio dentro del canal se muestra con una línea de puntos. Las líneas del canal son las líneas de soporte y resistencia. Esto permite utilizarlas tanto en operaciones de rebote como de ruptura. La inclinación del canal permite determinar la dirección de la tendencia actual, la anchura y el ángulo del canal permiten estimar la volatilidad actual. Los canales se basan en barras fractales, determinadas utilizando el método original del autor,
High Volatility es un indicador de utilidad que tiene la tarea de localizar velas volátiles. La función de reconocimiento y recuento de velas alcistas y bajistas lo convierten en un excelente aliado para comprender la volatilidad del mercado. Este punto suele definir posibles retrocesos y momentos de continuidad. Se dibuja un rectángulo en el gráfico para identificar la vela con mayor volatilidad en largo y en corto. Este indicador es muy eficaz para operar a corto, medio y largo plazo. Una aler

Ema Dashboard es un tablero innovador que le permite monitorear la Media Móvil en múltiples símbolos y diferentes marcos de tiempo. Este panel le permite analizar información sobre 28 pares en un gráfico único. Su funcionalidad incluye el análisis de todos los marcos temporales. Esta configuración le permite identificar la tendencia a largo plazo con extrema facilidad. Este panel le permite tomar movimientos direccionales muy importantes. Un clic en el botón abre un nuevo gráfico (símbolo y marc

Las entradas y salidas correctas del mercado son esenciales para cualquier operador de Forex. El indicador MasterArrow aborda esta cuestión. No tiene elementos redundantes y sólo dibuja flechas de compra/venta. La flecha hacia arriba es una señal de COMPRA, mientras que la flecha hacia abajo es una señal de VENTA. El indicador es fácil de configurar. Cambie el parámetro Fuerza para configurar la frecuencia de las señales. El producto se basa en indicadores estándar (MA, RSI, ATR, etc.). Pero tam
Canal híbrido de los indicadores Media móvil, Bandas de Bollinger, RSI y CCI. El filtrado único de las señales sin redibujar el indicador permite realizar diversas operaciones, tanto a medio como a corto plazo. El principio de funcionamiento del indicador radica en la búsqueda de los patrones de inversión del mercado. El método de detección de inversión de tendencia utiliza el canal de Media Móvil Triangular, que traza canales equidistantes no redibujables con un periodo de Desviación especifica

Project Future es un indicador de flechas profesional con funciones de notificación (alerta, correo electrónico, móvil). Ventajas del indicador Adecuado para scalping y trading intradía. Configuración simple y fácil del indicador. Funciona en todos los marcos temporales. No se redibuja. Se puede utilizar en cualquier mercado financiero: FOREX, CFD, opciones binarias, acciones. Se puede utilizar como herramienta independiente o junto con otros indicadores. Envío de señales a correo electrónico y

El indicador Unity Basket WPR (William's Percent Range) combina el WPR de varios pares en una cesta combinada de su divisa base definida. Esto le da señales de trading claras junto con TP y SL potenciales. Utilice el indicador junto con otros indicadores, como el ATR, para evitar situaciones de mercado plano y un indicador que le muestre la tendencia general como una MA (50). Opere con la tendencia.
Configuración Cesta de pares - lista de pares separados por comas (por defecto: EURUSD,EURJPY,EU

QQ-Deep Binary
El Principal objetivo del indicador QQ-Deep Binary, es determinar la dirección de la vela marcada, para Opciones Binarias. Funciona para cualquier par de divisas, presentando mejor resultado en instrumentos volátiles. El indicador está diseñado para simplificar el análisis del mercado, y se basa en estrategias de detección de patrones del precio combinado con la velocidad econométrica de múltiples divisas. El equipo de desarrollo está constantemente mejorando la funcionalidad de

TCD (Trend Convergence Divergence) se basa en el indicador MACD estándar con cálculos modificados. Muestra la fuerza de la tendencia, sus impulsos y retrocesos. TCD consta de dos histogramas, el primero muestra la tendencia principal, mientras que el segundo muestra los impulsos y retrocesos. Las ventajas del indicador incluyen: operar a lo largo de la tendencia, entrar en el mercado cuando se producen impulsos, operar basándose en la divergencia de la tendencia principal y la divergencia de los
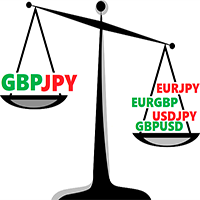
El oscilador de tendencia multidivisa Currency Strength Index Oscillator muestra la interacción de los índices de las divisas del símbolo actual calculados sobre la base de los tipos cruzados de las divisas principales.
Características Los cálculos se basan en barras completas, por lo tanto, no se redibuja. Funciona con cualquier símbolo que incluya las divisas principales (AUDJPY, AUDUSD, CHFJPY, EURAUD, EURCAD, EURCHF, EURGBP, EURJPY, EURUSD, GBPAUD, GBPCAD, GBPJPY, GBPCHF, GBPUSD, NZDJPY, NZ
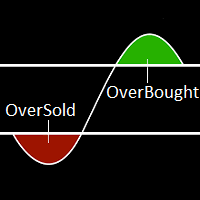
El término Sobrecompra describe un periodo de tiempo en el que se ha producido un movimiento alcista significativo y consistente en el precio durante un periodo de tiempo sin mucho retroceso. El término sobreventa describe un periodo de tiempo en el que se ha producido un movimiento bajista significativo y constante en el precio durante un periodo de tiempo sin mucho retroceso. Debido a que el precio no puede moverse en una dirección para siempre, el precio se dará la vuelta en algún momento. Es
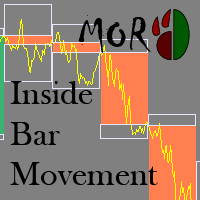
Este indicador permite analizar el movimiento de los precios dentro de una barra. El indicador dibuja los contornos de las barras de plazos superiores en el gráfico actual.
Valor de entrada TimeFrame - el marco de tiempo para mostrar las barras NumberOfDays - el número de días que el indicador calcula Bull_Body - el color del cuerpo de la barra alcista Bear_Body - el color del cuerpo de la barra bajista ShadowUp - el color de la sombra superior de la barra ShadowLow - el color de la sombra infe
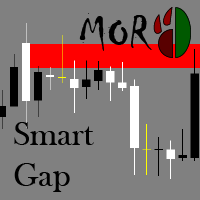
El indicador encuentra y visualiza las brechas de precios, que a menudo pueden utilizarse como niveles de soporte y resistencia. Puede mostrar niveles de diferentes marcos temporales en un gráfico.
Entradas Valor Label - mostrar/ocultar el marco temporal de los niveles construidos TimeFrame - selecciona el marco temporal desde el que dibujar los niveles DrawRangeDay - la longitud del nivel en días DrawRangeHour - la longitud del nivel en horas GapSizeForDrawing - un nivel será dibujado si la br

El indicador identifica los puntos de cambio de tendencia. No se redibuja. El cálculo se realiza en una vela activa. El cruce de las líneas se utiliza como punto de cambio de tendencia. Si el precio está por encima de las dos líneas, hay una tendencia alcista. Si el precio está por debajo de las dos líneas, hay una tendencia bajista. El indicador le permite entrar con precisión en el mercado durante un cambio de tendencia. También puede utilizarse en estrategias personalizadas sobre una tendenci

Esta estrategia multidivisa determina simultáneamente la fuerza de las tendencias, los puntos de entrada y los niveles de toma de beneficios para cada operación. El indicador puede determinar puntos de entrada en cualquier periodo de negociación, desde M1 hasta D1. Para mayor comodidad de los usuarios, el indicador muestra el punto de entrada (en forma de flecha), los niveles recomendados de take profit (TP1, TP2, TP3) y el nivel recomendado de stop loss (SL1, SL2). A continuación se describen l
El Mercado MetaTrader es la única tienda donde se puede descargar la versión demo de un robot comercial y ponerla a prueba, e incluso optimizarla según los datos históricos.
Lea la descripción y los comentarios de los compradores sobre el producto que le interese, descárguelo directamente al terminal y compruebe cómo testar el robot comercial antes de la compra. Sólo con nosotros podrá hacerse una idea sobre el programa, sin pagar por ello.
Está perdiendo oportunidades comerciales:
- Aplicaciones de trading gratuitas
- 8 000+ señales para copiar
- Noticias económicas para analizar los mercados financieros
Registro
Entrada
Si no tiene cuenta de usuario, regístrese
Para iniciar sesión y usar el sitio web MQL5.com es necesario permitir el uso de Сookies.
Por favor, active este ajuste en su navegador, de lo contrario, no podrá iniciar sesión.