Indicadores técnicos gratis para MetaTrader 4 - 10

Lord Auto Fibonnaci is a free indicator for Meta Trader, in order to show the most famous chart in the financial market known as "Fibonnaci".
As we can see in the images below, the fibonnaci table will automatically analyze the graph for you, with trend factors through percentage, almost infallible use, you can always work when the percentage is low or high, start shopping and sales on time, great for analyzing entries!
In the images below we can see an example in gold in H4, where we are a
FREE

Bollinger Bands Breakout Alert is a simple indicator that can notify you when the price breaks out of the Bollinger Bands. You just need to set the parameters of the Bollinger Bands and how you want to be notified.
Parameters: Indicator Name - is used for reference to know where the notifications are from Bands Period - is the period to use to calculate the Bollinger Bands Bands Shift - is the shift to use to calculate the Bollinger Bands Bands Deviation - is the deviation to use to calculate
FREE

English : A GF_support+MA.mq4 indikátor átfogó eszközként szolgál a kereskedési döntések támogatására a MetaTrader 4 platformon. Fő funkciója, a LookBackPeriod beállítás lehetővé teszi a kereskedők számára, hogy beállítsák a támogatási és ellenállási szintek kiszámításához használt időszak hosszát. Ez a paraméter határozza meg az elemzési periódus hosszát a gyertyákban, ami döntő fontosságú a piaci csúcsok és mélypontok azonosításához, ezáltal pontosan megrajzolja a támasz- és ellenállásvonala
FREE

This indicator signals about crossing of the main and the signal lines of stochastic (lower stochastic) in the trend direction which is determined by two stochastics of higher time frames (higher stochastics). It is not a secret that stochastic generates accurate signals in a flat market and a lot of false signals in a protracted trend. A combination of two stochastics of higher time frames performs a good filtration of false signals and shows the main tendency. The indicator is recommended for
FREE
The indicator is designed for fast scalping. The principle of operation of the indicator is based on the direction of the Moving Average.
The period and sensitivity of the Moving Average can be adjusted for yourself in the indicator settings. I recommend watching my advisor - Night Zen EA
Subscribe to my telegram channel, link in my profile contacts. Advantages of the indicator: The free version is full, there are no additional purchases The arrows are not redrawn, the signal comes after
FREE
Indicator Rua Alert Trend Line. This indicator will notify when the price breaks any trendline on the chart. Notifications will be sent to the phone and on MT4. Custom parameters: in_NumbersAlert: The number of notifications that will be sent when the price breaks the trendline. A product of Ruacoder Provide code indicator and EA services upon request. Contact: Telegram : https://t.me/Ruacoder
FREE
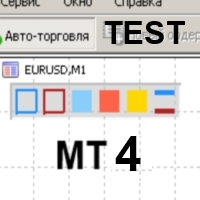
Color Levels - удобный инструмент для тех, кто использует технический анализ с использованием таких инструментов, как Трендовая линия и Прямоугольник. Имеется возможность настройки двух пустых прямоугольников, трех закрашенных и двух трендовых линий. Настройки индикатора крайне просты и делятся на пронумерованные блоки: С цифрами 1 и 2 вначале - настройки пустых прямоугольников (рамок); С цифрами 3, 4 и 5 - настройки закрашенных прямоугольников; С цифрами 6 и 7 - настройки трендовых линий. Объе
FREE

This is a multitimeframe RSI indicator defining trends, oversold/overbought zones, as well as all intersections of signal lines from different timeframes on a single chart using arrows and audio alerts. When working with standard RSI, we often need to examine data from all necessary timeframes simultaneously. RSI 7TF solves this issue. If you are only interested in audio signals when signal lines are crossed, then have a look at RSI Alerts . Attention! The indicator uses seven timeframes - M5, M
FREE
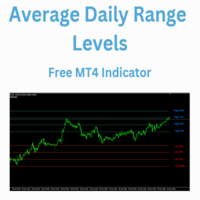
El indicador Average Daily Range Levels muestra los niveles de ADR en el chart como si fuesen soportes y resistencias y se va actualizando diariamente.
Por defecto el indicador usa el promedio de 5 dias de rango diario. Hay varias estrategias que sugieren que estos niveles pueden usarse para determinar hacia donde puede rebotar el precio y suele decirse que el precio se puede mover normalmente un 75 % del ADR
En futuras versiones quizás agregue alertas en cada nivel
Puedes suguerir algun
FREE

[La desviación de cada indicador MT4] es una colección de 18 indicadores, y uno de ellos puede seleccionarse arbitrariamente para participar en el cálculo. Puede calcular la forma de desviación de cada indicador y puede provocar una alarma.
Descripción del ajuste de parámetros:
[indicadores] es elegir uno de los 18 indicadores para participar en el cálculo (este parámetro es muy importante) .
[período] es un ciclo común para cada indicador.
[Método] es el modo MA de algunos indicadores
FREE

MASi Three Screens is based on the trading strategy by Dr. Alexander Elder. This indicator is a collection of algorithms. Algorithms are based on the analysis of charts of several timeframes. You can apply any of the provided algorithms.
List of versions of algorithms:
ThreeScreens v1.0 - A simple implementation, with analysis of the MACD line; ThreeScreens v1.1 - A simple implementation, with analysis of the MACD histogram; ThreeScreens v1.2 - Combines the first two algorithms
FREE

With this system you can spot high-probability trades in direction of strong trends. You can profit from stop hunt moves initiated by the smart money!
Important Information How you can maximize the potential of the scanner, please read here: www.mql5.com/en/blogs/post/718109 Please read also the blog about the usage of the indicator: Professional Trading With Strong Momentum This FREE Version of the indicator works only on EURUSD and GBPUSD. The full version of the indicator can be found here:
FREE

Screener Breakout Congestion: Have you ever missed a trading opportunity because you were not looking at the chart of that market in that specific time frame? Here is this screener to help you identify congestion breakouts in the markets you want to follow in the different time frames required. Once you have identified the markets (forex, indices, CDF) and the different time frames (1M, 5M, 15M, 30M, 1H, 4H, Daily), the screener is represented by several buttons that change colour when the conge
FREE

Después de 7 años he decidido publicar algunos de mis indicadores y EA de forma gratuita.
Si los encuentras útiles, por favor ¡Muestra tu apoyo con una valoración de 5 estrellas! ¡Tu feedback mantiene las herramientas gratuitas llegando! Ve también mis otras herramientas gratuitas aquí
_________________________________ Indicador de Ancho de Bandas de Bollinger para Análisis Avanzado de la Volatilidad del Mercado El Indicador de Ancho de Bandas de Bollinger, meticulosamente desa
FREE

GTAS FidTdi is a trend indicator using combination of volatility and potential retracement levels. This indicator was created by Bernard Prats Desclaux, proprietary trader and ex-hedge fund manager, founder of E-Winvest.
Description The indicator is represented as a red or green envelope above or under prices.
How to use Trend detecting When the envelope is green, the trend is bullish. When it is red, the trend is bearish.
Trading Once a trade is opened, GTAS FibTdi shows retracement zones
FREE

Defining Range ( DR ) and Implied Defining Range ( IDR ) indicator
Show DR and IDR ranges on the chart for Regular , Overnight and After Sessions
for more information how DR and IDR work and the high probability watch : https://www.youtube.com/@themas7er or https://twitter.com/IamMas7er
Remember to set set your chart TimeZone when you attach indicator to the chart under indicator settings / inputs
Volume Imbalance : https://www.mql5.com/en/market/product/91165?source=Site+Pr
FREE
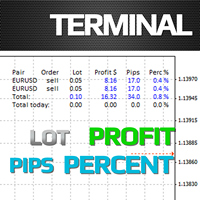
The Terminal indicator is a substitution for the standard Terminal tab. The indicator is displayed as a kind of table consisting of several elements: A row with column descriptions; Open orders; Summary information of open orders; Summary information of current day closed orders. The indicator settings: Graph corner for attachment - the corner of the chart where the table will be positioned Font - font type Fontsize - font size Text color - display settings
Profit color - display settings Loss
FREE

Idioteca FTU El indicador es para la plataforma MT4, se puede usar solo pero es mejor combinarlo con otros indicadores o estrategias. Combina varios indicadores como macd, adx para dibujar una flecha que sugiere entrada o cambio de tendencia. Vea un breve vídeo de introducción en youtube: https://youtu.be/lCRJ3mFNyOQ Características del indicador: Vender y comprar flechas Alerta visual y sonora. Continuación de la tendencia/señal temprana de cambio de tendencia Nuevas características: Limitar l
FREE

The UNIVERSAL DASHBOARD indicator will eliminate the need of using dozens of indicators on dozens of charts. From one place you can monitor all the pairs and all the timeframes for each of the following indicators: MACD STOCHASTIC WPR RSI CCI You can also use any Custom indicator in the dashboard as long as it has a readable buffer. With a single click you can quickly navigate between charts, pairs and timeframes. Alerts will provide clear indication about what happens for your favorite pairs on
FREE
This is a custom indicator based on the Exponential Moving Average (EMA) angle, typically used to measure the trend angle of EMA lines. Here are the main parameters and functions of this indicator: Main Parameters: md1: Fast period for EMA, default value is 12. md2: Slow period for EMA, default value is 26. md3: Period for the MACD signal line, default value is 9. Functions: The indicator calculates the MACD indicator and categorizes data into different buffers based on the direction and angle o
FREE

The indicator looks for market Highs and Lows. They are defined by fractals, i.e. the market creates the indicator algorithm and structure, unlike ZigZag having a rigid algorithm that affects the final result. This indicator provides a different view of the price series and detects patterns that are difficult to find on standard charts and timeframes. The indicator does not repaint but works with a small delay. The first fractal level is based on the price, the second fractal level is based on t
FREE

A powerful trend analysis tool for traders of all levels Super Trend Analyzer is a technical analysis tool that uses the Relative Strength Index (RSI) and Moving Average (MA) indicators to identify trends in the market. It is a versatile tool that can be used by traders of all levels of experience.
How does it work An uptrend begins when the main trend line and the auxiliary trend line cross from below and the lower minor oscillator is on the rise. A downtrend begins when the main trend line a
FREE

The indicator helps to determine the potential for price movement within the day and on a trend. For calculations, the average price movement on the instrument is used. If you have a problem setting TP, the indicator allows you not to overestimate your expectations. For volatile instruments, the SL position can also be taken into account. If the entry was in the right place, the risk / reward ratio will prompt a profitable level for profit taking. There is a reset button at the bottom of the sc
FREE

1. Los pivotes mensuales, semanales y diarios se calculan con los datos iniciales y finales de cada período.
2. Esto proporciona una línea fácil en el gráfico para identificar dónde están los pivotes y reducir el error de cálculo.
3. El indicador ayudará a definir muy rápidamente los pivotes principales del instrumento, incluso si no entiende cómo calcular el pivote.
4. También puede comparar los pivotes semanales y diarios para que pueda comprender mejor la posición del precio.
5 Este i
FREE
BeST_Colored Candles is an MT4 FREE indicator that can change the color of the Candlesticks based on the MACD, SAR or RSI values and levels. It is a Composite indicator that by selection uses the values each one of these 3 indicators and their critical levels in order to create numerical relationships that when satisfied cause their corresponding candlesticks coloration.
Input parameters
== Basic Settings
-- Please Select Indicator - for selecting which one of the above 3 indicator
FREE

Presentamos a Ms. Fibonacci , un indicador poderoso y gratuito diseñado para simplificar el proceso de dibujar y ajustar los niveles de Fibonacci en su gráfico. Este indicador identifica y marca automáticamente los nuevos niveles de Fibonacci más altos y más bajos, lo que garantiza una ubicación exacta y precisa. Una de las características clave de Ms. Fibonacci es su capacidad para dibujar correctamente los niveles de Fibonacci, punto a punto, y marcar los niveles de precios correspondiente
FREE

This is Fibo Expansion. You can use it, as profit target at any level... It use price Highs and Lows and price between... It is simple and easy to use... No Input menu, just drag it on your chart and it ready to use... The blue and red dot color indicate it direction... It also use as the same as fractal high and low price as the points to construct the levels... No more analysis to choose the points..
FREE

Si te gusta este proyecto, deja una revisión de 5 estrellas. Seguir en instagram: borelatech Trading grandes volúmenes requiere que veamos múltiples instrumentos/chartes a
encontrar nuevas oportunidades, este indicador le ayudará trazando
niveles por el múltiples de un número o su sufijo y actualizarlos
automáticamente
como el precio cambia, una tarea que de otro modo sería tedioso. Por ejemplo, en GBPUSD, usted podría tener 4 instancias del indicador en el
gráfico a trama: Cada intervalo
FREE

SR is a support and resistance indicator, it shows major highs and lows by different colors. The color of a level is changing if the last high or low are touching it. After the closing of a bar above or below level, it will delete it. extern inputs: loop for candles / colors / drawing time *This indicator signal is not perfect and have to be used with other market analysis and confirmations.
FREE

This indicator is not only for trading but also for learning, thanks to it, you can learn to identify trend, support and resistance.
You've probably heard about the Dow trend theory, where higher highs and higher lows indicate an uptrend, and lower highs and lower lows indicate a downtrend. This indicator determines this trend based on the Dow Theory. You just need to enter a number representing the number of candles between extremes. The optimal solution is the number 3 (H1 TF), unless you
FREE

O Touch VWAP é um indicador que permite calcular uma Média Ponderada por Volume (VWAP) apenas apertando a tecla 'w' no seu teclado e após clicando no candle do qual deseja realizar o calculo, clicando abaixo do candle é calculada a VWAP baseado na minima dos preços com o volume, clicando sobre o corpo do candle é calculado uma VWAP sobre o preço medio com o volume e clicando acima do candle é calculado uma VWAP baseado na máxima dos preços com o volume, voce tambem tem a opção de remover a VWAP
FREE

All traders should know the trend before making their decision when placing the buy or sell orders. The first step always starts with supply and demand , rising and falling channels , trend lines, engulfing candles etc. All the above contribute to what is called “Price Action” and that is the best and most reliable way in trading and catching the trend and making profits, without stress. The Investment Castle Trend Line Indicator will automatically draw the trend lines on the MT4 for you. An
FREE
This is a very simple but very powerful strategy. It has a lot of potential. This strategy is based on the popular moving average crossover but with a very interesting twist to it. It has some mechanisms to delay signals untill direction is clear and confirmed. Follow the indication colors and arrows for trade ideas It has a potential winning rate of somewhat greater than 70%. Try it in all timeframes and determine which one is good for you. ===========
FREE

Average daily range, Projection levels, Multi time-frame ADR bands shows levels based on the selected time-frame. Levels can be used as projections for potential targets, breakouts or reversals depending on the context in which the tool is used. Features:- Multi time-frame(default = daily) Two coloring modes(trend based or zone based) Color transparency
FREE

TH3ENG CURRENCY STRENGTH SCANNER The best currency strength reader based on more than 4 excellent modes, based on Price action and Volume with various algorithms. This indicator reads all pairs data to measure and find the best results of all currencies and arrange it in a separated dashboard panel.
You can find the strongest currency and the weakest currency, then trade on them pair. NOT COPLICATED NOT REPAINTING NOT LAGING
Input Parameters
=== SYSTEM SETTING === Calc. Mode ==> Calculatio
FREE

Super Channels indicator is a channel indicator created by calculating support and resistance levels. It calculates by taking the average of support and resistance levels. After determining the number of candles, it takes the levels of the number of candles and creates an autonomous channel according to these levels. If you want to calculate how many candles, you must enter the number in the parameter section. Also, there are two types of modes in the indicator. The first is to calculate based o
FREE
Download the free version here.
A Full Concept of BUY/SELL Scalping Strategy Trend detection is one of the basic challenges of every trader. Finding a way to tell when to enter a trade is very important, timing is a game changer, not too early and not too late. Sometimes, due to not knowing the market conditions, the trader closes his positions with a small profit or allows the losses to grow, these are the mistakes that novice traders make. Indicator Trend Whipper is a complete trading st
FREE

The Zig-Zag based levels indicator is a highly accurate tool for Forex trading that will help you improve your strategy and make more precise decisions. It uses the Zig-Zag algorithm to identify various support and resistance levels on the market, based on which you can determine when it is best to enter or exit a trade.
This indicator has high performance and accuracy in calculating levels, which allows traders to gain maximum profits with minimal risks. Thanks to its intuitive interface, yo
FREE

Un indicador de tendencia que muestra la fuerza de los alcistas y bajistas en un rango de cotización.
Consta de dos líneas:
La línea verde es una condición equilibrada de sobrecompra/sobreventa. La línea roja es la dirección de la actividad comercial. No vuelve a dibujar los cálculos.
Se puede utilizar en todos los Símbolos/Instrumentos/Marcos de tiempo.
Fácil de usar y configurar.
Cómo utilizar el indicador y qué determina.
La regla básica es seguir la dirección de la línea roja:
s
FREE

This is an indicator detecting trend direction. It uses the popular Bill Williams Alligator. It shows market state on all timeframes on one chart. As is well known, traders gain the main profit on the Forex market trading by trend, and losses usually occur when the market is flat. So, in order to gain profit a trader should learn to detect trend market and direction of a current trend in a rapid manner. This indicator has been developed for this purpose. MTF Alligator helps to: Profitably trade
FREE

This indicator shows Higher Time Frame ( HTF ) Candles on the current chart. It will help you to identify Higher Time Frame ( HTF ) candles price ( Open price/ High price / Low price / Close price ). The colors of the Bull/Bear HTF candles are selectable. You can also change the Transparency of the HTF candles to make them more beautiful. Inputs
Higher Time Frame (HTF) Shift Bull Candle Color Bear Candle Color Transparency Max Bars
FREE

Análisis de trading preciso al alcance de tu mano: software de análisis de trading de nueva generación El software de análisis de trading convencional disponible en el mercado a menudo solo proporciona estadísticas de la relación entre ganancias y pérdidas por hora o por semana, lo que no satisface la necesidad de un análisis de trading más preciso. Sin embargo, en el mercado de trading real, cada día presenta circunstancias únicas. Los lunes son tranquilos, los miércoles son activos con un tri
FREE

The "Dagangduit Spread Indicator" is a versatile tool designed to provide traders with essential information about the current spread in the chart window. This indicator offers customizable features, including font parameters, display location on the chart, spread normalization, and alerts to enhance your trading experience. Key Features: Real-time Spread Display : The indicator displays the current spread in real-time on your trading chart, allowing you to stay informed about the cost of execut
FREE

This indicator is designed to find the difference in RSI price and indicator. This indicator shows the price and indicator difference on the screen. The user is alerted with the alert sending feature. Our Popular Products Super Oscillator HC Cross Signal Super Cross Trend Strong Trend Super Signal
Parameters divergenceDepth - Depth of 2nd ref. point search RSI_Period - Second calculation period indAppliedPrice - Applied price of indicator indMAMethod - MA calculation method findExtInt
FREE

Gran herramienta de utilidad donde puede monitorear en tiempo real el Laverage de su cuenta y la propagación del símbolo Este sabrá identificar con precisión los datos, poder saber, por ejemplo, si tiene una cuenta de Prop Firm, saber el Laverage correcto y si se manipula el spread, etc. para hacer un lotage preciso.
Combinación de apalancamiento e indicador de diferencial. Herramientas para automatizar la verificación del apalancamiento y el diferencial en su cuenta comercial. Trabajando en
FREE
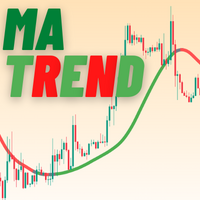
MATrend indicator makes the directional trend of the current market easily recognizable. Settings: MA Period : The amount of candles taken into consideration for the calculation of the moving average; MA Method : The method used for the calculation of the moving average. Selectable methods are: Simple averaging;
Exponential averaging;
Smoothed averaging;
Linear-weighed averaging; Usage: The color of the indcator will change based on the slope of the MA. Green : The indicator has a bullish
FREE

The ' Average Bar Chart ' indicator was created to showcase the traditional Heiken Ashi calculation as an exotic charting style. This indicator is known for reducing chart noise for a smoother price action. A dditional indicators are recommended
Key Features Candlesticks for OHLC are removed from the chart. Average bars may be shown as complete bars without tails. All functionality and features of this exotic chart are inputs.
Input Parameters Chart Timeframe = PERIOD_CURRENT; - period to s
FREE

Después de 7 años, he decidido liberar algunos de mis propios indicadores y Asesores Expertos (EA) de forma gratuita.
Si los encuentras útiles, por favor, muestra tu apoyo con una calificación de 5 estrellas. Tu retroalimentación me motiva a seguir ofreciendo herramientas gratuitas. Consulta mis otras herramientas gratuitas aquí
_________________________________ Indicador ATR con Bandas para un Análisis Avanzado de la Volatilidad del Mercado Forex Presentamos el Indicador ATR co
FREE

Camarilla Pivots Historical plots the historical data of the camarilla pivot point levels on the chart. The Camarilla Pivot levels was originated in 1989 by Nick Scott. The levels are used as primary support and resistance levels by Intraday traders. The levels are calculated with the following formula: R4 = C + RANGE * 1.1/2 R3 = C + RANGE * 1.1/4 R2 = C + RANGE * 1.1/6 R1 = C + RANGE * 1.1/12 PP = (HIGH + LOW + CLOSE) / 3 S1 = C - RANGE * 1.1/12 S2 = C - RANGE * 1.1/6 S3 = C - RANGE * 1.1/4 S4
FREE

BeST_ Classic Pivot Points is an MT4 Indicator that is based on the widely known and definitely classic Pivot Point of a market prices activity. A pivot point is calculated as an average of significant prices (high,low,close) from the performance of a market in the prior trading period. If the market in the following period trades above the pivot point it is usually evaluated as a bullish sentiment, whereas trading below the pivot point is seen as bearish. A pivot point and the associated suppo
FREE
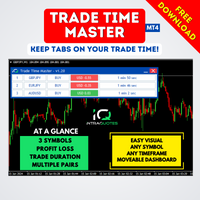
Enhance your trading precision with our revolutionary product, Trade Time Master Pro. This indicator provides unique insights into the duration of your active trades, offering a comprehensive view of their time in Days, Hours, Minutes, and Seconds. Note: It is requested that download must be refrained from if the user is from India, Bangladesh, or Pakistan, as developer support for these regions is unavailable due to legal restrictions. Indicator Features:
Time Display:
Indicator shows first
FREE

FZR indicator determines fractal zigzag reversal pattern of all the time frames of the chosen symbol and shows the information in the Info label. Indicator draws the detected pattern in the chosen time frame and also you can select in the menu to draw the trend line according to FZR peaks. What it is FZR? See the first picture in the screenshots. As you can see for every peak of FZR the AO indicator must cross zero line. FZR indicator determines the trend direction.
How to use FZR for trading?
FREE

Trends are like the "Saint Graal of traders": it can give you an higher win rate, a better risk to reward ration, an easier position management and so on...
But it is really hard to determine the trend with accuracy, avoiding fase signals, and with the right timing, in order to take massive movements. That's why I created the Trend Validator: a new and EASY tool that will make identifying trend and build new strategy a really easier work.
ANATOMY OF THE SOFTWARE
The indicator is composed b
FREE

Daily pivot are relatively important in trading. This indicator have options to select 5 commonly use pivot point calculations. User input Choose Pivot Point Calculation ( Method Classic, Method Camarilla, Method TomDeMark, Method Fibonacci or Method Woodies. ) Choose Applied Timeframe for the calculation (M5, M15, H1, H4, D1, W1 etc) Can be attached to any timeframe Choose color of Pivot point For MT5 version, please refer here: https://www.mql5.com/en/market/product/38816
FREE

Lisek Stochastic oscillator indicator with Alarm, Push Notifications and e-mail Notifications. The Stochastic indicator is a momentum indicator that shows you how strong or weak the current trend is. It helps you identify overbought and oversold market conditions within a trend. The Stochastic indicator is lagging indicator, which means it don't predict where price is going, it is only providing data on where price has been !!!
How to trade with Stochastic indicator: Trend following: As lon
FREE

The indicator is completely based on the classic MFI indicator. I recommend watching my advisor - Night Zen EA
It contains two basic trading strategies: The output of the MFI line from overbought/oversold zones. The entry of the MFI line into the overbought/oversold zones. Arrows are drawn after confirming the signal by strategies and are not redrawn.
Alerts are also registered: Alerts Push notifications to the mobile terminal email Settings: MFI period - the period of the MFI indicator L
FREE

NOTE!: The trend vote and the buy sell option shall match to the same direction before you put a trade!!
Indicator that uses Kalman filters (same as used on autonomous vehicles for data fusion between different sensors / technologies such as RADAR, LIDAR and Camera with Artificial Intelligence for object detection) by using the high and low price in order to identify buy and sell signals as indicated on the graph.
This indicator can be used on any timeframe with any currency or symbol.
Thi
FREE

IceFX Heatmap is a special indicator that shows the places where the price has been staying and ranging over the past few days. These sites will be displayed in a "Heatmap style", with which you can clearly see the main formed bands. The main rates (where the price has "lingered/stayed" much) are indicated in bright colors (in case of black-and-white view) or red color (in case of color view).
Settings Days - the number of days the heat(map) is calculated for. Resolution - resolution rate. 10
FREE

M1Arrows is a MT4 trend arrows Indicator
* Smart Scalper Setup (M1) :: Signal 5 Main 20 + Signal 20 Main 80 + Fibonacci ZigArcs 20
(Screenshot1) Add the indicator with first setting,
then add it again to the same graph with other settings.
You can add as many as you want, but 2 M1Arrows in just one graph is enought
Never open orders againt the slow setting trend
Do not open more than 3 orders per slow setting trend
It will work better in Europe/USA markets, * M15 Day Trade Setup: Sig
FREE

В основе индикатора TDI лежат следующие индикаторы: RSI, Moving Average, Bollinger bands, но основным из них нужно выделить RSI, весь расчет индикатора завязан от его значений.
Зеленая линия (линия RSI) – сглаженные простой (по умолчанию) скользящей средней значения индикатора RSI, период сглаживания 2.
Красная линия (сигнальная линия) – сглаженные простой (по умолчанию) скользящей средней значения индикатора RSI, период сглаживания 7.
Синие линии – индикатор Bollinger bands по умолчанию п
FREE

An indicator for visualizing time ranges of key trading sessions: Asian, European, and American. The indicator features functionality for setting the start and end times of each trading session, as well as an adjustable timezone of the trading server. The main advantages of the indicator include the ability to operate with minimal CPU load and memory usage. Moreover, it offers the option to specify the number of displayed historical days, providing the user with flexible market dynamics analysis
FREE
Enhance your trading strategy with this indicator from tr1cky.com . When the indicator turns red - Hold off When the indicator turns green - Proceed with the trade in the direction indicated by the indicator This indicator provides insights into the market’s momentum and the optimal trading direction. Derived from its successful Expert Advisor counterpart, the RSIMFI100 go indicator is now available to all. Happy trading!
FREE

Download directly the indicator file here. (if you can't open on MT4) MACD Indicator is one of the most popular momentum indicators among users. Searching and detecting MACD signals by the eye may not be easy. Scan Full Charts Dashboard Indicator with simple user interface and search customization panel saves time and scans all charts for MACD signals search and notifies the user with high accuracy. After finding the signal, the user was aware of the result by alerts and notifications. This ind
FREE
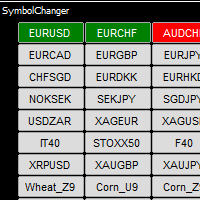
Symbol Chart Changer is an indicator/utility that offers you the option to switch between symbols and timeframes. You can choose any symbol and timeframe on the same chart with just a few clicks. In addition, this indicator also shows the profit of the symbol through the color of the buttons. For MT5: Symbol Chart Changer for MT5 Features
All symbols selected in MarketWatch, that allow you to monitor your favorite instruments on the same chart. Works smoothly on any symbol/instrument, accou
FREE

The Supertrend Line indicator shows you the trend using calculation based on the ATR.
How does it work? The Supertrend draws a line following the current trend, this line is the result of calculation made with the ATR. A Line under the candle means a likely bullish trend A Line above the candle means a likely bearish trend
How to trade with CSL indicator Buy when the Supertrend line is below the price, Sell when the Supertrend line is above the price. It is strongly suggested to use this ind
FREE

Los promedios móviles cambian sobre la marcha. El indicador selecciona automáticamente el período para calcular las medias móviles. Cuanto más direccional es el movimiento, mayor es el período de promedio. Con la desaceleración de la tendencia, el período de las medias móviles disminuye y se vuelven más rápidas. Esto permite una respuesta más rápida al cambio de tendencia.
El indicador funciona bien en la tendencia o en el punto de reversión de la tendencia. En la barra lateral, el indicador
FREE

The purpose of this new version of the MT4 standard indicator provided in your platform is to display in a sub-window multiple timeframes of the same indicator. See the example shown in the picture below. But the display isn’t like a simple MTF indicator. This is the real display of the indicator on its timeframe. Here's the options available in the FFx indicator: Select the timeframes to be displayed (M1 to Monthly) Define the width (number of bars) for each timeframe box Alert pop up/sound/ema
FREE

The RSI Arrows MTF indicator is based on the RSI indicator. Represents input signals in the form of arrows. It has 6 types of calculation. All signals are generated on the current bar of the selected period.
Signals do not redraw in the first 4 modes! But it is possible to redraw in cases of a sharp change in market movement.
All signals in MTF mode correspond to signals of the period specified in MTF. It is maximally simplified to use both for trading with only one indicator and for using
FREE

RaysFX EMA Crossover Scopri i potenziali punti di inversione del mercato con l’indicatore di Crossover EMA di RaysFX. Questo indicatore utilizza una combinazione di due medie mobili esponenziali (EMA) - una più veloce e una più lenta - per identificare i possibili punti di ingresso e uscita. Caratteristiche principali : Due EMA : Utilizza una EMA più veloce e una più lenta per catturare i movimenti di mercato a breve e lungo termine. Segnali di crossover : Genera un segnale quando l’EMA più v
FREE
Easily track and trade with the trend using this indicator. Uses a circle and line to indicate the trend direction. Excellent for channels. Features alert function.
Parameter TrendPeriod can be changed to your preference. How to use: Simply attach to any chart. Blue circle plus blue line cross below price = Buy. Red circle plus red line cross above price = Sell. Best results when taking higher time frames into consideration before entering a trade. (Hint: Wait for the radar/circle to appear on
FREE
MetaTrader Market es el mejor lugar para vender los robots comerciales e indicadores técnicos.
Sólo necesita escribir un programa demandado para la plataforma MetaTrader, presentarlo de forma bonita y poner una buena descripción. Le ayudaremos publicar su producto en el Servicio Market donde millones de usuarios de MetaTrader podrán comprarlo. Así que, encárguese sólo de sus asuntos profesionales- escribir los programas para el trading automático.
Está perdiendo oportunidades comerciales:
- Aplicaciones de trading gratuitas
- 8 000+ señales para copiar
- Noticias económicas para analizar los mercados financieros
Registro
Entrada
Si no tiene cuenta de usuario, regístrese
Para iniciar sesión y usar el sitio web MQL5.com es necesario permitir el uso de Сookies.
Por favor, active este ajuste en su navegador, de lo contrario, no podrá iniciar sesión.