 MetaTrader 5
 Experts
 Indicators
 Scripts
 Libraries
 Storage
Join our fan page

- Views:
- 109
- Rating:
- Published:
-
 You are missing trading opportunities:
- Free trading apps
- Over 8,000 signals for copying
- Economic news for exploring financial markets
Registration Log inYou agree to website policy and terms of use
If you do not have an account, please register -
 Need a robot or indicator based on this code? Order it on Freelance
Go to Freelance
Need a robot or indicator based on this code? Order it on Freelance
Go to Freelance
Buffer Inspector Kb is a script that answers the first question of anybody who wants to use an indicator in an Expert Advisor or an alert tool: which buffer holds the signal? Drop it on a chart that already has the indicator. It reads every buffer of every indicator on the chart, including the colour and calculation buffers that the Data Window does not show, tells what each buffer holds - arrows, a line or a colour index - and writes the buffer number next to the last arrows on the chart.
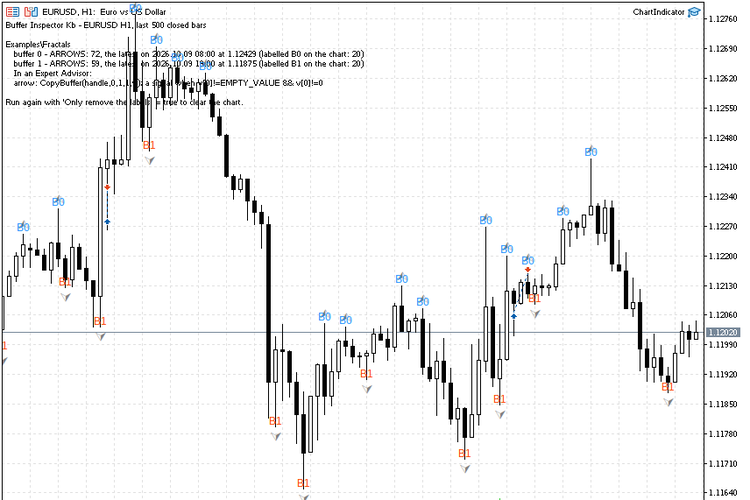
Examples\Fractals: B0 is written above the upper fractals and B1 below the lower ones; the report is on the chart and in the Experts journal
Why the Data Window is not enough
The Data Window lists only the buffers that are drawn. A colour buffer (the colour of Heiken Ashi candles, of a two-colour moving average) is hidden there, and every buffer after it gets a different number in an Expert Advisor than its position in the Data Window suggests. Indicators bought on the Market come without source code, so the SetIndexBuffer calls cannot be read either. The script reads the buffers the way an Expert Advisor does, with CopyBuffer, so the numbers it shows are the numbers to use in iCustom.
How a buffer is classified
- Arrows: values on 30% of the bars or fewer, empty (EMPTY_VALUE or 0) on the others. The report gives the number of arrows and the time and price of the latest one, and the arrows are labelled B0, B1... on the chart.
- Colour index: only small whole numbers in a narrow range, for example 0 and 1. The report gives the range and the value on the last closed bar, so the number can be matched with the colour you see.
- Line: a value on almost every bar. The report gives the current value and the range.
- Empty: no values on the inspected bars.
Only closed bars are read: the forming bar of many arrow indicators changes until it closes. If an indicator has no arrow buffer although arrows are visible on the chart, the report says that the indicator probably draws them as objects, which no program can read through iCustom.
Input parameters
| Parameter | Default | Description |
|---|---|---|
| Indicator name (InpIndicator) | empty | Empty: inspect every indicator attached to the chart, with the inputs set on the chart. A name (the path inside MQL5\Indicators, for example Examples\Fractals or Market\Name): create that indicator and inspect it. |
| Its inputs (InpParams) | empty | For a named indicator: its inputs, comma separated, in the order of its inputs window. Empty means its defaults. |
| Closed bars to inspect (InpBars) | 500 | How many closed bars are read for every buffer. |
| Arrows to label (InpMarks) | 20 | How many of the latest arrows of each arrow buffer get a label on the chart. 0 disables the labels. |
| Only remove the labels (InpClear) | false | true: delete the labels and the report of a previous run and do nothing else. |
Using the result in an Expert Advisor
For every arrow buffer the report ends with the line to use: CopyBuffer(handle, n, 1, 1, v) and a signal when v[0] is neither EMPTY_VALUE nor 0. Read the last closed bar (shift 1) and react once per new bar; some indicators confirm a signal later - a fractal needs two more bars - and then the signal bar is 3, not 1.
The source code is short and commented: it shows ChartIndicatorGet for indicators that are already on the chart, IndicatorCreate with a parameter list built from a text string, waiting for BarsCalculated, and the classification of a buffer by its values.
 Session Range Boxes with Killzones, Breakout Alerts and Stats
Asian, London and New York session high/low boxes with ICT killzone shading, breakout alerts and average-range statistics panel.
 GridPro Panel — open-source grid trading EA with on-chart control panel
open-source grid trading EA with on-chart control panel
StopDistance - bar range in points with a suggested stop level
Shows the range of every bar in points, its moving average (SMA or EMA) and a suggested stop distance (average x factor). A stop tighter than the typical bar range gets taken out by ordinary noise; the indicator makes that threshold visible in points, the same unit a stop loss is set in.
 ExportBars - bars to CSV that pandas reads without arguments
Exports bars to a CSV file that pandas.read_csv() loads without encoding, separator or date-format arguments: ISO 8601 timestamps, prices at the symbol's own digits, single-byte encoding. Two modes (last N bars or a date range) and a switchable separator for Excel.