Roberto Sant Ana Junqueira
4.7 (378)
  • Information
5+ years
experience
42
products
105
demo versions
7
jobs
0
signals
0
subscribers
Roberto Junqueira, is Trader for over 20 years and has been developing indicators and trading experts for more than 10 years for the Forex, Cryptocurrencies and Stock Exchanges markets.
Roberto Sant Ana Junqueira
Left feedback to customer for job Create 4 simple indicators (Only Moving Averages) for MT4
Roberto Sant Ana Junqueira
Left feedback to customer for job Small change in this indicator
Roberto Sant Ana Junqueira
Left feedback to customer for job Moving Average Indicator
Roberto Sant Ana Junqueira Published product
Reviews: 11
FREE

Aggression Wave RSJ adds up the difference between buy and sell aggression candle after candle and plots it as waves, so you can see which side is controlling the order flow during the day. WHAT IT DOES Computes the aggression delta of each candle (aggressive buys minus aggressive sells) and accumulates it into waves. Colors each wave by direction, so a change of control between buyers and sellers is visible at a glance. Draws a signal line over the waves to show the direction of the flow

Roberto Sant Ana Junqueira Published product
Reviews: 25
FREE

Up to 7 Fibonacci pivot levels per side. For graded supply/demand zones with retest count: Supply Demand RSJ PRO Pivot Point Fibo RSJ draws the daily pivot point and its support and resistance levels calculated with Fibonacci ratios. It plots up to 7 support levels and 7 resistance levels from the previous day's high, low and close. Traders use these levels as reference areas to plan entries, exits and stop placement during the day. Features Up to 7 levels of support and 7 levels of resistance

Pruthvirajsinh6212
Pruthvirajsinh6212 2023.02.23
How can value find out R7,R6,R5....... CopyBuffer(Pivot_handle,0,0,1) - 1 Value Is R7 ?
Roberto Sant Ana Junqueira Published product
Reviews: 12
FREE

Weis Waves RSJ adds up the volume of each price wave and plots it as a histogram of cumulative volume for the alternating up and down waves. This lets you compare the effort (volume) of each wave with its result (price progress) and see when a move is supported by volume or is losing strength. How to read it Each bar of the histogram is the total volume traded during one price wave. When a trend is healthy, the waves in the direction of the trend usually show more volume than the corrections

Roberto Sant Ana Junqueira Published product
Reviews: 14
FREE

VWAP Fibo Bands RSJ draws the VWAP of the selected period and builds bands around it using Fibonacci proportions. The indicator plots 10 band levels around the VWAP. The bands show how far price has moved from the volume weighted average price and can be used as reference levels to plan entries, exits and stops. The bands are easiest to read on timeframes of 30 minutes and below. Inputs Calculation Volume Type Calculation Price Type VWAP Period Time Each band is drawn at a fixed Fibonacci

Roberto Sant Ana Junqueira Published product
Reviews: 45
FREE

Free Tabajara setup for B3. Trading WIN? See our Trend WIN B3 robot. Setup Tabajara was created by a Brazilian trader known as  "The OGRO of Wall Street" . The idea of this setup is to indicate to the trader the current trend of prices and  the type of operation should be looked for in the graph. Operation It does this through the positioning of the closing of the candles and the  vwap until 10:40am and after by the arithmetic mean of 20 periods painting

Roberto Sant Ana Junqueira Published product
Reviews: 129
FREE

Candle Timer Countdown shows how much time is left to close the current candle. It updates every second, even when no new tick arrives, using the broker server clock. Want the same countdown on your order ticket? OCO Panel PRO shows it in its footer, next to one-click orders and saved OCO exits. WHAT IT SHOWS Time left as mm:ss, h:mm:ss, or days on D1, W1 and MN. "Market closed" when the symbol is outside its trading session. Daily % change, symbol and timeframe (each one can be turned on or

Roberto Sant Ana Junqueira Published product
Reviews: 8
FREE

Candle Counter RSJ prints the number of each candle counted from the first candle of the day. The first candle of the day is number 1 and each new candle adds 1 to the count. Input Parameters Show even, odd or all numbers Distance between the candle and the number Text font size Text font color How to use Counting candles helps when a setup depends on the number of bars since the market opened, for example a rule that only takes trades after the third candle of the day, or a review of what

max1968
max1968 2022.12.24
а как пользоваться этой системой .есть пример? или разбор?
Roberto Sant Ana Junqueira Published product
Reviews: 13
FREE

VWAP RSJ plots the hourly, daily, weekly and monthly VWAP lines on the same chart. Large institutional buyers and funds use the VWAP to enter and exit positions with the smallest possible market impact. They usually try to buy below the VWAP and sell above it, which tends to pull price back toward the average. This indicator combines the four VWAP periods so you can see where price stands against each of them. How to read it Each VWAP line starts again at the beginning of its period: the hourly

Roberto Sant Ana Junqueira Published product
Reviews: 1
30.00 USD

Renko Price Action ATR builds a Renko chart in which the size of each brick is calculated from the ATR of the period you select. Renko charts filter out small price movements, so trends, supports and resistances, and top and bottom divergences are easier to see. Operation Works with any symbol. The Renko chart is updated in real time. Settings ATR Calculation Timeframe: timeframe used to calculate the ATR and the brick size. ATR Calculation Averaging Period: number of periods of the ATR average

Roberto Sant Ana Junqueira Published product

Delta Aggression Volume shows, candle by candle, whether aggressive buyers or aggressive sellers traded more, on symbols with real trades such as B3 and CME futures. WHAT IT DOES Computes the aggression delta of each candle: volume of aggressive buys minus volume of aggressive sells. Plots the balance of every candle in a separate window, colored by the side that won. REQUIREMENTS Exchange symbols with real trades: B3 futures and stocks (WIN, WDO, PETR4 …) and CME futures (ES, NQ, CL, GC and

Roberto Sant Ana Junqueira Published product
Reviews: 2
FREE

Volume By Color RSJ paints the volume bar in a darker color when the traded volume is above its own moving average, so candles with unusual activity stand out. An optional four-color mode shows the strength of each candle's volume in steps. By default the indicator compares each bar with the 20-period simple average of the volume. The average type and period can be changed in the inputs. How to use The colored bars make it easy to spot breakouts, rejections and climax candles that happen with

Roberto Sant Ana Junqueira Published product
Reviews: 15
FREE

Free Tabajara setup for B3. Trading WIN? See our Trend WIN B3 robot. The Tabajara setup was created by a Brazilian trader known as "The OGRO of Wall Street". It shows the current trend and the type of trade to look for on the chart. How it works The indicator compares the closing price with the 20-period simple moving average and paints the candles in 4 colors: Green: price rising in an uptrend (look for buy entries) Black: price correcting in an uptrend (look for buy entries) Red: price falling

Roberto Sant Ana Junqueira Published product
Reviews: 60
FREE

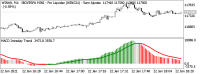
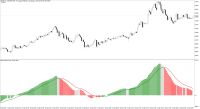
Free Fibonacci-tuned MACD for intraday trends. Want alerts and the full toolkit? MACD Intraday Trend PRO MACD Intraday Trend is an Indicator developed through an adaptation made of the original MACD created by Gerald Appel in the 1960s. Through years of trading it was observed that by changing the parameters of the MACD with Fibonacci proportions we achieve a better presentation of the continuity of the trend movements, making that it is possible to more efficiently detect the beginning and

Roberto Sant Ana Junqueira
Published screenshot
WIN$N, M1Rico (XP Investimentos CCTVM)
Roberto Sant Ana Junqueira
Published screenshot
WIN$N, M1Rico (XP Investimentos CCTVM)