Roberto Sant Ana Junqueira / Profile
- Information
|
5+ years
experience
|
42
products
|
105
demo versions
|
|
7
jobs
|
0
signals
|
0
subscribers
|
Volume By Color RSJ paints the volume bar in a darker color when the traded volume is above its own moving average, so candles with unusual activity stand out. An optional four-color mode shows the strength of each candle's volume in steps. By default the indicator compares each bar with the 20-period simple average of the volume. The average type and period can be changed in the inputs. How to use The colored bars make it easy to spot breakouts, rejections and climax candles that happen with
Free Tabajara setup for B3. Trading WIN? See our Trend WIN B3 robot. The Tabajara setup was created by a Brazilian trader known as "The OGRO of Wall Street". It shows the current trend and the type of trade to look for on the chart. How it works The indicator compares the closing price with the 20-period simple moving average and paints the candles in 4 colors: Green: price rising in an uptrend (look for buy entries) Black: price correcting in an uptrend (look for buy entries) Red: price falling
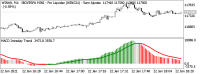
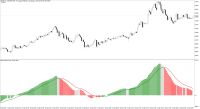
Free Fibonacci-tuned MACD for intraday trends. Want alerts and the full toolkit? MACD Intraday Trend PRO MACD Intraday Trend is an Indicator developed through an adaptation made of the original MACD created by Gerald Appel in the 1960s. Through years of trading it was observed that by changing the parameters of the MACD with Fibonacci proportions we achieve a better presentation of the continuity of the trend movements, making that it is possible to more efficiently detect the beginning and