|
4 years
experience
|
26
products
|
4
demo versions
|
|
0
jobs
|
0
signals
|
0
subscribers
|
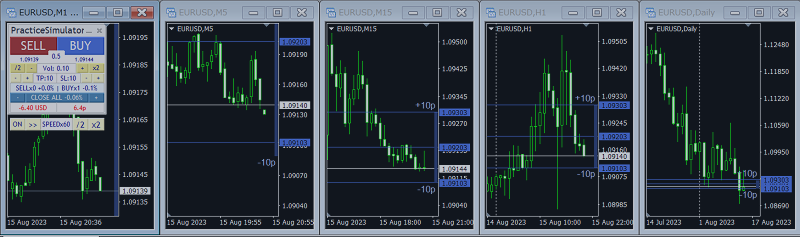
The best way to Master Trading with PracticeSimulator - the ultimate tool for mastering trading strategies! Whether you're a beginner or an experienced trader, this tool helps you practice, learn, and refine your skills in a completely risk-free environment.
Why Choose PracticeSimulator?
- No Risk, Unlimited Practice: Hone your trading skills without risking real money.
- Powerful Simulation Anytime: Test strategies under realistic market conditions, even on weekends.
- Beginner-Friendly & Skill-Enhancing: Simple for beginners, effective for refining advanced strategies.
Available Now on MQL5 Market
https://www.mql5.com/en/market/product/98348
Stay Connected!
Send me a Friend Request—I approve all! On MQL5, it works like following, so feel free to connect and stay updated.