Before the first single test, every trader faces the same question — "Which of the four modes to use?" Each of the provided modes has its advantages and features, so we will do it the easy way - run all four modes at once with a single button! The article shows how to use the Win API and a little magic to see all four testing chart at the same time.
Any trader's trading activity involves various mechanisms and interrelationships including relations among orders. This article suggests a solution of OCO orders processing. Standard library classes are extensively involved, as well as new data types are created herein.
The article describes the automation of trend lines plotting based on the Fractals indicator using MQL4 and MQL5. The article structure provides a comparative view of the solution for two languages. Trend lines are plotted using two last known fractals.
This article considers using the Rattle package for automatic search of patterns for predicting long and short positions of currency pairs on Forex. This article can be useful both for novice and experienced traders.
The article provides a description of a universal method for analyzing and converting data from HTML documents based on CSS selectors. Trading reports, tester reports, your favorite economic calendars, public signals, account monitoring and additional online quote sources will become available straight from MQL.
Finding rules for a trade system and programming them in an Expert Advisor is a half of the job. Somehow, you need to correct the operation of the Expert Advisor as it accumulates the results of trading. This article describes one of approaches, which allows improving performance of an Expert Advisor through creation of a feedback that measures slope of the balance curve.
This article suggests the ways of improving manual trading strategy by applying fuzzy set theory. As an example we have provided a step-by-step description of the strategy search and the selection of its parameters, followed by fuzzy logic application to blur overly formal criteria for the market entry. This way, after strategy modification we obtain flexible conditions for opening a position that has a reasonable reaction to a market situation.
Decision trees imitate the way humans think to classify data. Let's see how to build trees and use them to classify and predict some data. The main goal of the decision trees algorithm is to separate the data with impurity and into pure or close to nodes.
Renat Akhtyamov : одно но если это все будет действительно интересно я уже задал вопрос - что за коэффициент тау, из каких соображений столько знаков после запятой а в ответ тишина и разобраться в
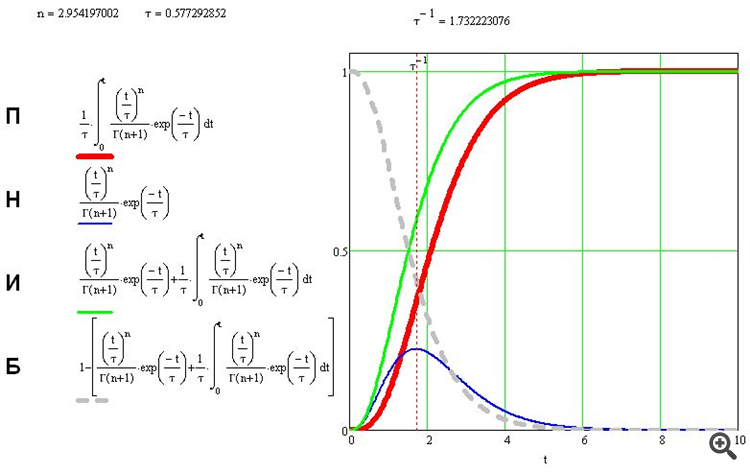
Доктор : Пытаюсь всмотреться в формулу П. Не вижу никакого окошко для подстановки цены. Почему? Видите отношение переменной интегрирования t к тау7 это и есть окошко. Переменная t - это цена. О тау
Доктор : Юсуф, а формулы в вашем первом посте имеют какое-то отношение к текущему обсуждению? Куда там цены-то подставлять? Все вычисления производятся формулой П. Она имеет окошко для подстановки
The use of computer vision allows training neural networks on the visual representation of the price chart and indicators. This method enables wider operations with the whole complex of technical indicators, since there is no need to feed them digitally into the neural network.