Torque Effort Analyzer
- Indicators
-
Syarief Azman Bin Rosli
 Hello and welcome to my official MQL5 profile!
I am Syarief Azman Bin Rosli, an algorithmic trading systems developer and quantitative software engineer with over a decade of specialized experience creating robust automated trading solutions for MetaTrader 5 and MetaTrader 4. - Version: 1.0
- Activations: 5
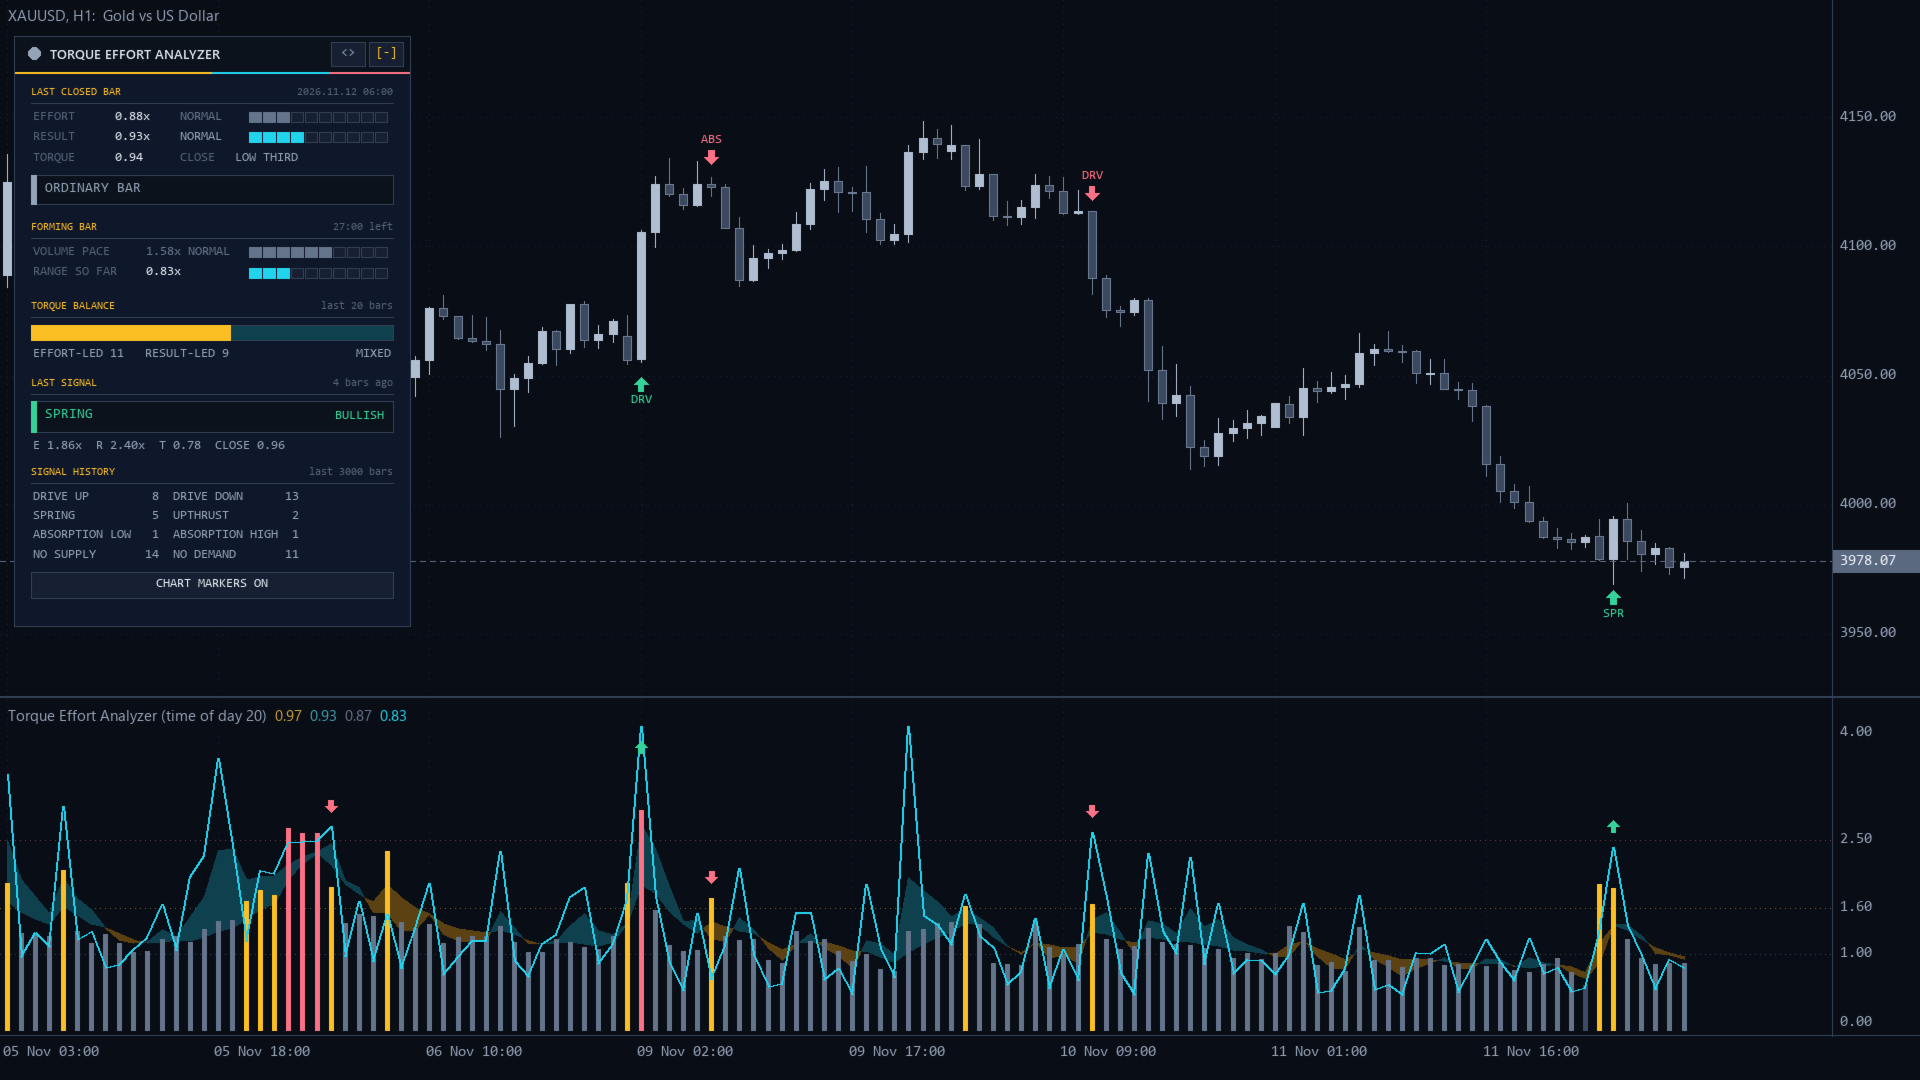
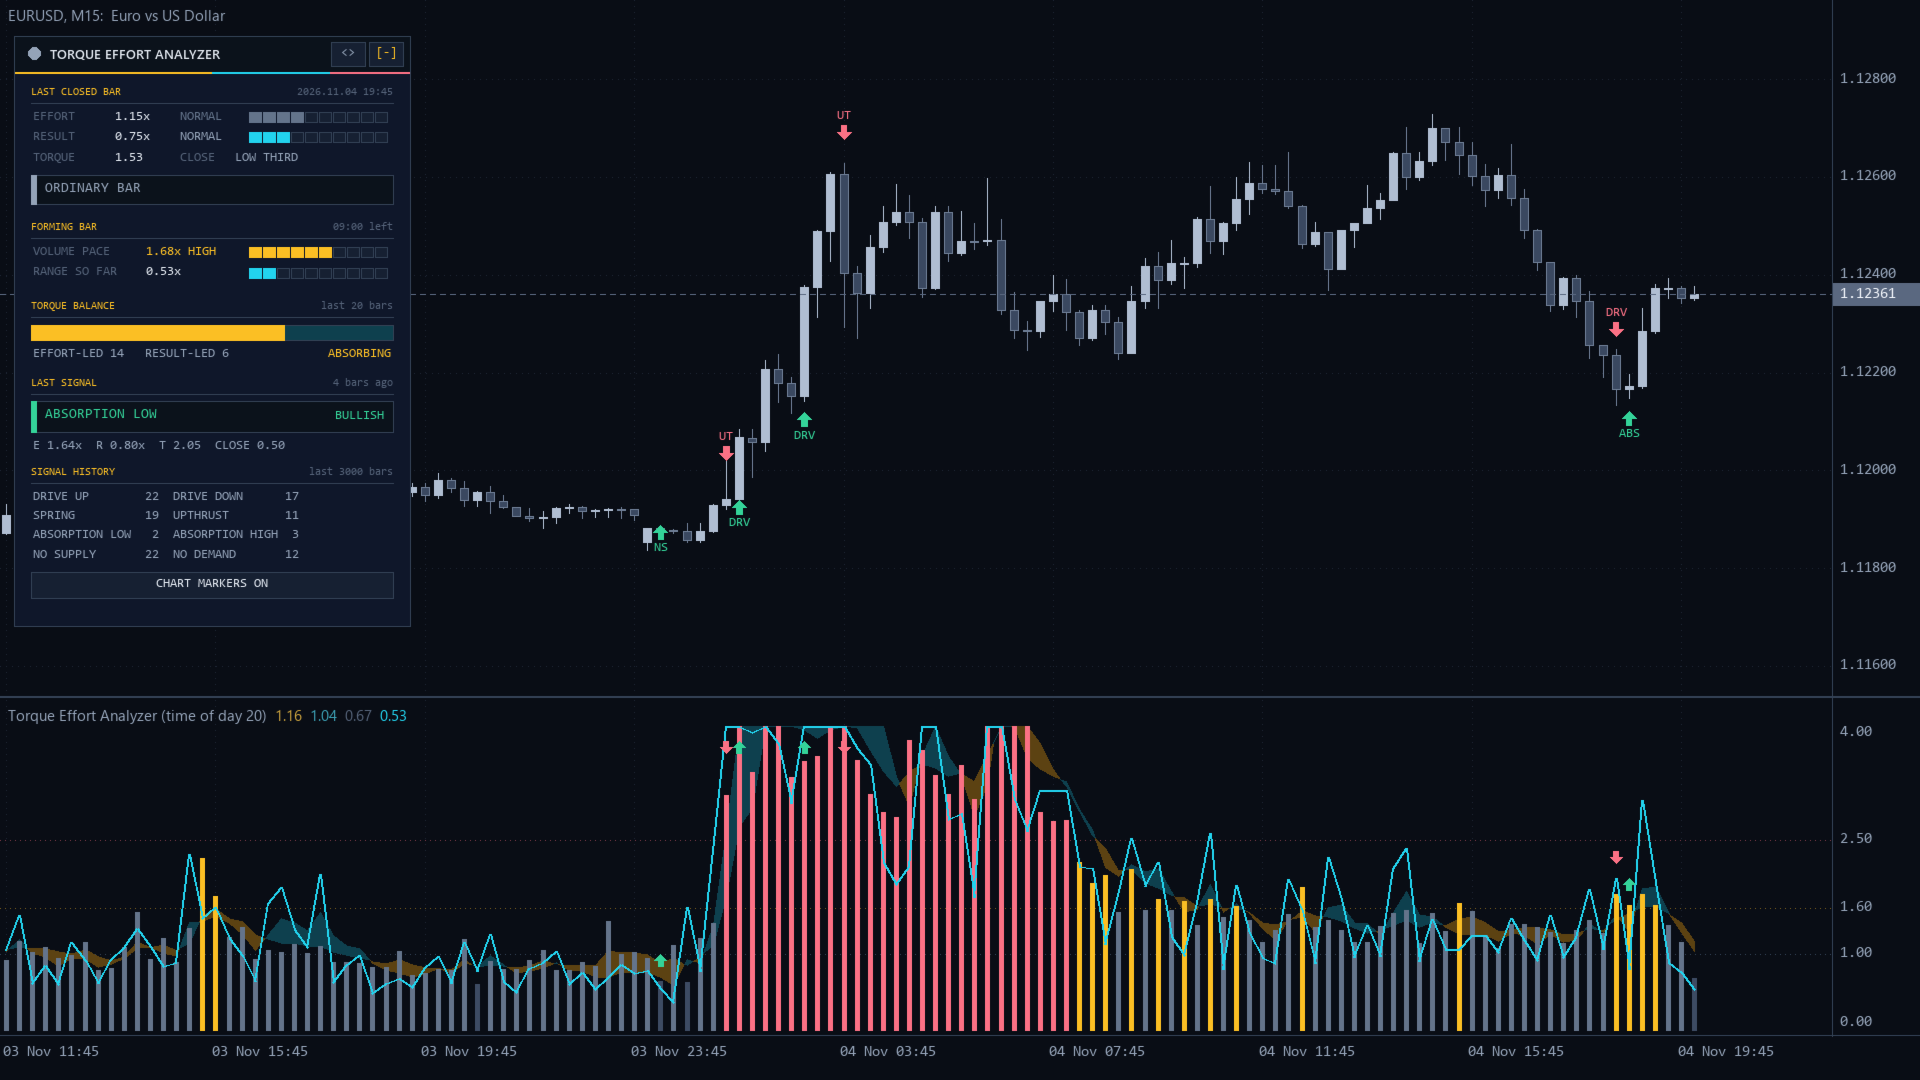
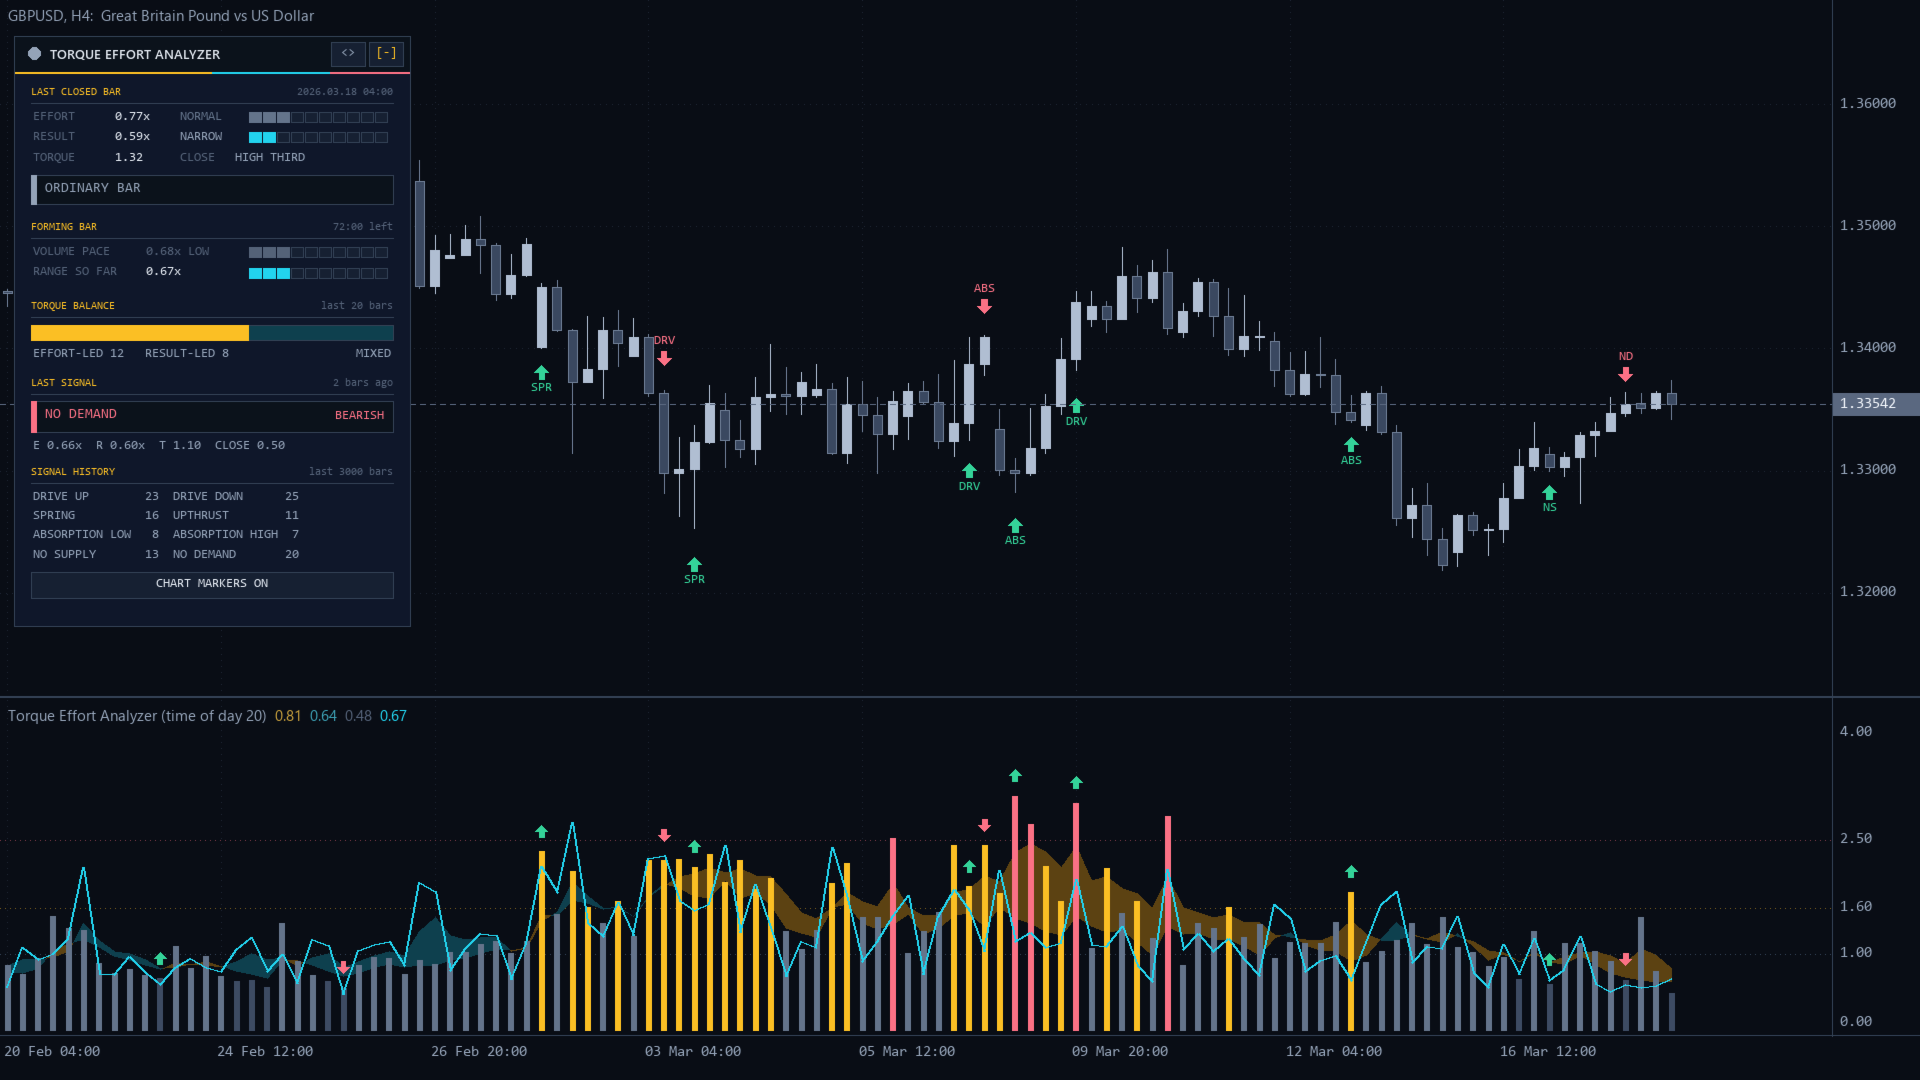
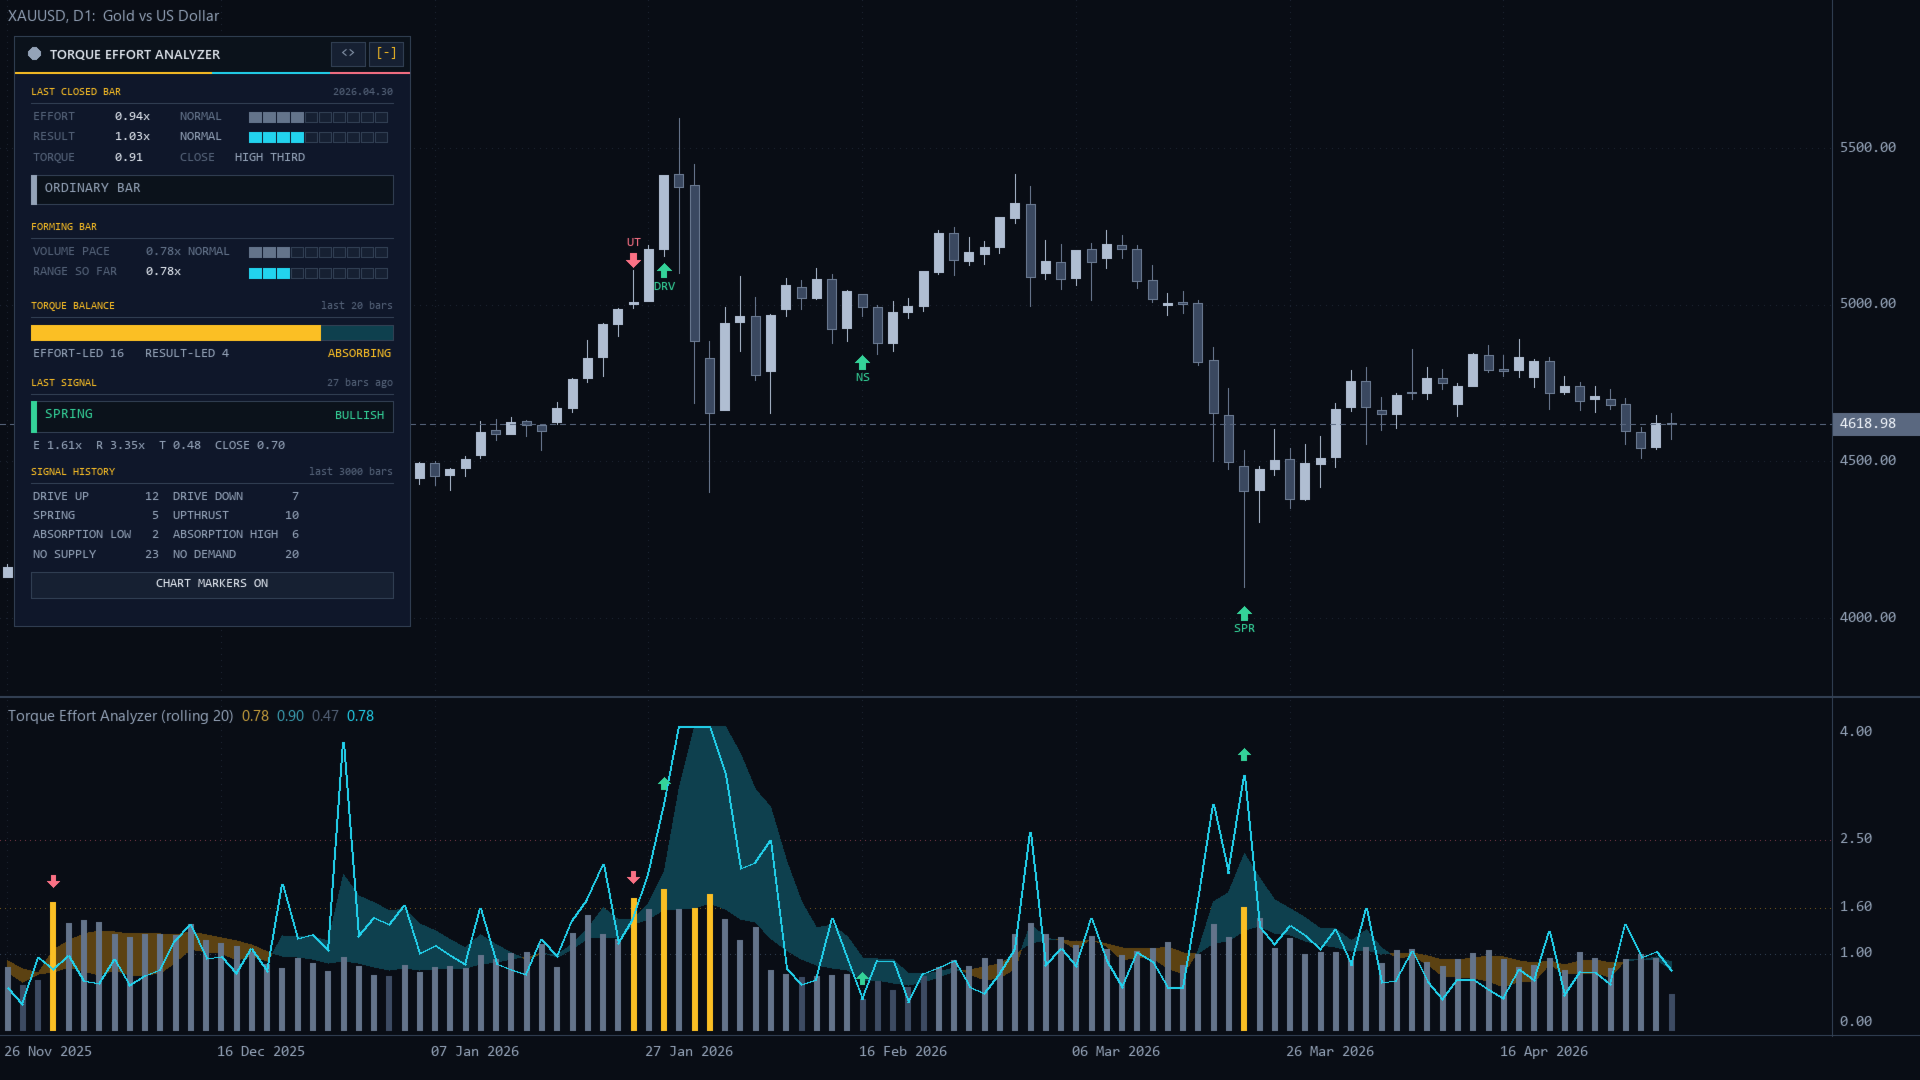
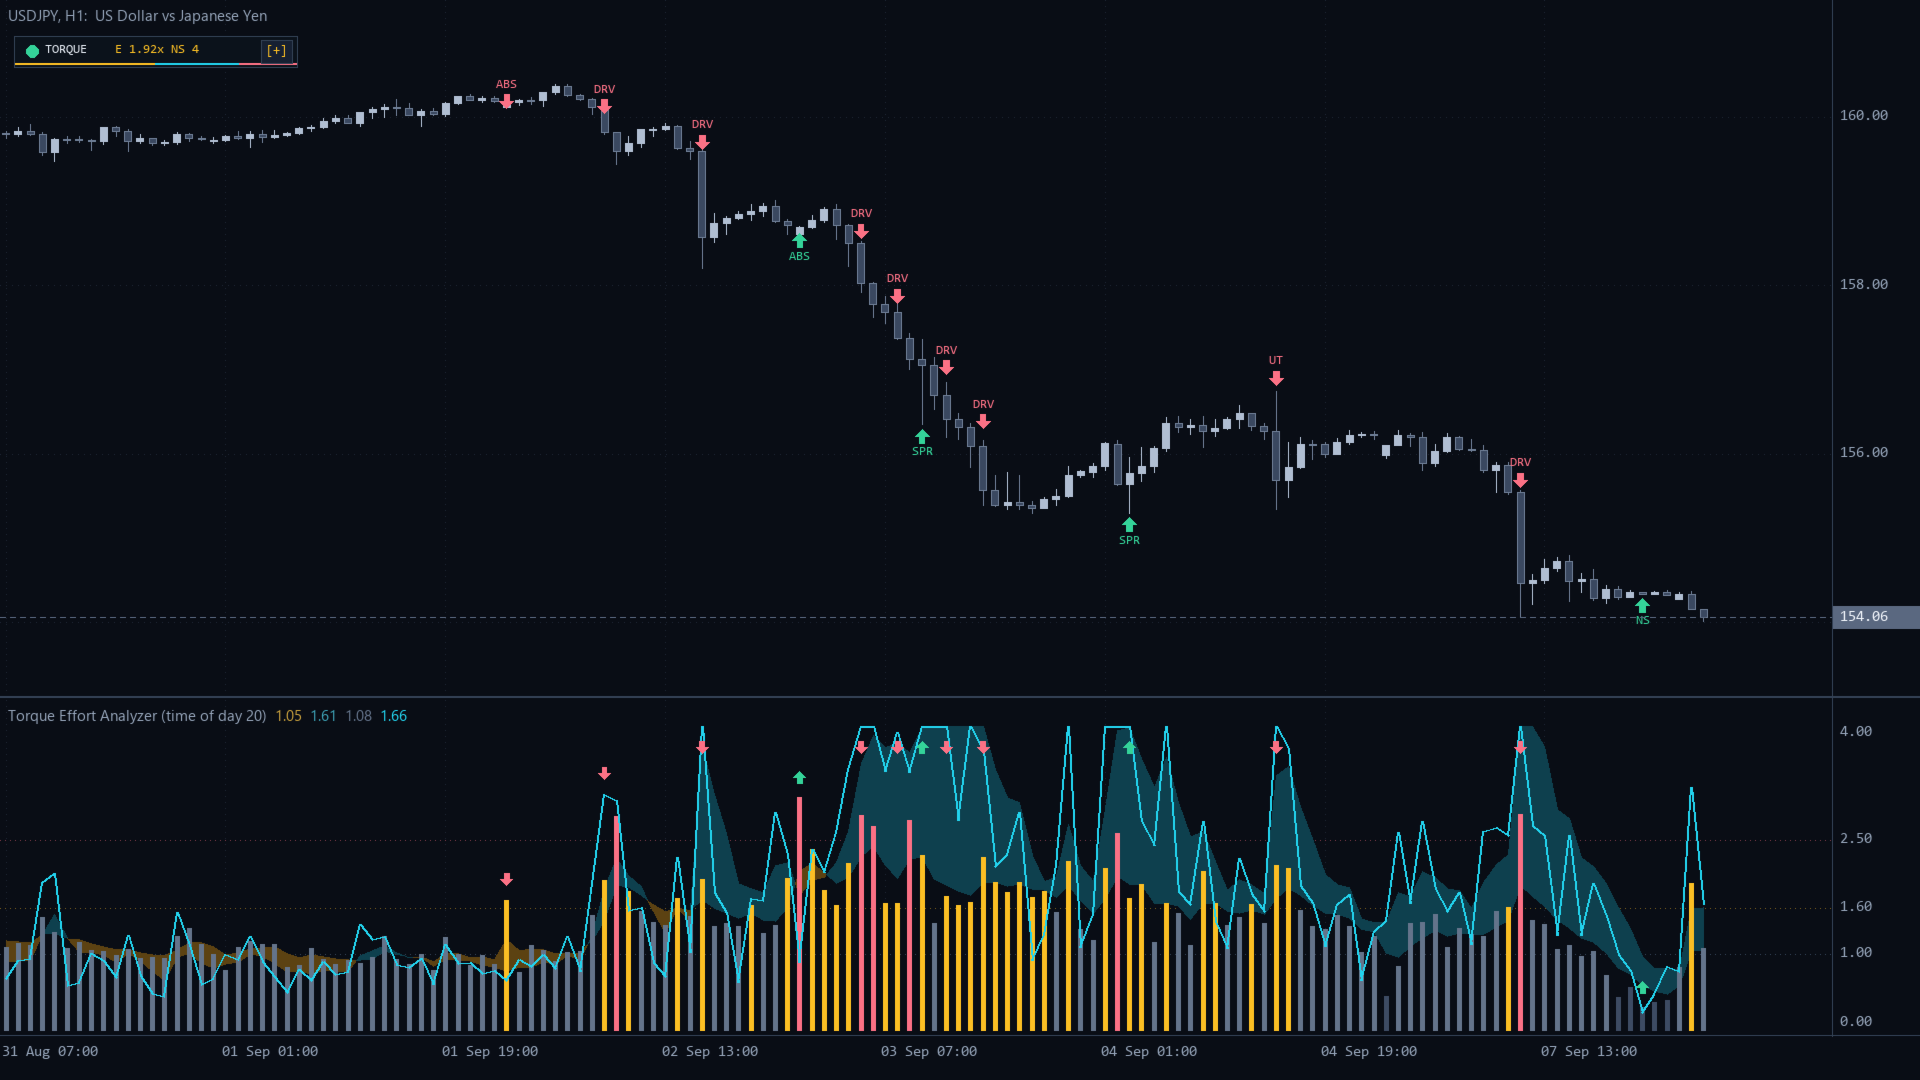
Torque Effort Analyzer is a MetaTrader 5 indicator for effort versus result (volume spread analysis). Effort is the bar's volume, result is the bar's range, and both are measured against the same time of day on the last N days, so the quiet Asian hours and the busy London open are each judged against their own normal. Torque = effort / result. It shows a torque cloud, a tiered effort histogram and the result line in its subwindow, marks eight confirmed patterns on the price chart and reports everything on a telemetry card. Signals never repaint. It does not trade.
Quick Start
- Attach it to any chart. It opens its own subwindow and draws markers and the card on the price chart.
- Keep the defaults: Baseline Mode = Same time of day, Baseline Length = 20, Volume Source = Tick volume.
- Wait for Min Samples Before Reading days of history per time slot (the card shows BASELINE BUILDING until then; with normal chart history it reads at once).
- Quick check: a visual Strategy Tester run on EURUSD H1 shows the histogram, cloud and markers appear bar by bar.
- For phone alerts set your MetaQuotes ID under Tools > Options > Notifications and Push Notification = true.
How It Measures
- Effort = bar volume / median volume of the previous Baseline Length bars in the same time-of-day slot (on H1 the 14:00 bar is compared with the last 20 bars at 14:00). Above 1.00 = busier than usual for that hour.
- Result = bar range (high - low) / median range of the same slot.
- Torque = effort / result (result floored at 0.05). Above 1 = more volume than the move it produced.
- The bar being measured is never part of its own baseline.
- Rolling bars mode, and every timeframe of D1 or higher, use the previous Baseline Length bars instead of time slots.
- A slot needs Min Samples Before Reading values first; until then effort and result are empty.
- Volume Source: Tick volume works everywhere. Real volume is for exchange symbols; if a symbol reports no real volume the indicator falls back to tick volume and prints a message.
Tiers: effort LOW below Low Effort Below, NORMAL, HIGH from High Effort From, ULTRA from Ultra Effort From. Result NARROW below Narrow Result Below, NORMAL, WIDE from Wide Result From.
The Eight Patterns
Checked once per closed bar. Context = the previous Context Bars bars: a new high (low) is a high (low) beyond all of them; range position = where the close sits between the lowest low and highest high of the context plus the bar (0 = bottom, 1 = top). Close location = (close - low) / (high - low).
- UPTHRUST (bearish, UT): new high, close in the lower third, effort HIGH or more.
- SPRING (bullish, SPR): new low, close in the upper third, effort HIGH or more.
- DRIVE UP (bullish, DRV): new high, close in the upper third, effort HIGH or more and result WIDE.
- DRIVE DOWN (bearish, DRV): new low, close in the lower third, effort HIGH or more and result WIDE.
- ABSORPTION LOW (bullish, ABS): effort HIGH or more, torque at least Absorption Torque From, range position 0.25 or lower.
- ABSORPTION HIGH (bearish, ABS): the same with range position 0.75 or higher.
- NO SUPPLY (bullish, NS): down close, effort LOW, result NARROW, volume below each of the two previous bars, range position 0.5 or lower.
- NO DEMAND (bearish, ND): up close, the same quiet conditions, range position 0.5 or higher.
One pattern per bar, priority in the order above. The same pattern is not repeated within Min Bars Between Identical Signals bars. Only closed bars are classified, so a signal never changes or disappears; the forming bar's histogram, cloud and result line update live.
In our tests on EURUSD, XAUUSD, GBPUSD and USDJPY (M5 to D1, about 30,000 bars each) no pattern on its own predicted the next 10 bars much better than chance. Read them as context for your own levels and trend, not as entry signals.
Subwindow Readouts
- Torque cloud: smoothed effort against smoothed result (EMA of Torque Cloud Smoothing bars). Amber where effort leads (volume without matching movement), cyan where result leads (price moving easily).
- Effort histogram: dark slate LOW, slate NORMAL, amber HIGH, coral ULTRA.
- Result line: cyan.
- Arrows: green up for bullish patterns, coral down for bearish, just above the bar.
- Dotted levels at 1.00 (normal), High Effort From and Ultra Effort From. Window Maximum fixes the scale top (taller bars are cut off visually, buffers keep the real values); 0 = automatic scale.
Price Chart Markers
Each signal gets an arrow next to the candle and a tag beyond it: DRV, SPR, ABS or NS in green below the bar, DRV, UT, ABS or ND in coral above it. Hover for the full name, effort, result and torque. Only the newest Max Markers Drawn markers are kept.
Card Controls
- [-] / [+]: collapse the card into a pill (TORQUE, the last effort and the last signal tag with its age) or expand it.
- <>: move the card to the next chart corner.
- CHART MARKERS ON / CHART MARKERS OFF: show or hide the price-chart markers. Subwindow arrows stay.
Collapse, corner and markers return to the inputs when the indicator is re-attached or the timeframe changes.
Card Readouts
The header reads TORQUE EFFORT ANALYZER; its status dot takes the colour of the last closed bar's verdict.
- LAST CLOSED BAR (bar time on the right): EFFORT and RESULT with value, tier and a 10-cell meter (0.3 per cell), TORQUE, CLOSE (LOW THIRD, MIDDLE, HIGH THIRD) and the verdict: EFFORT WITH RESULT (effort HIGH and result WIDE, green), EFFORT WITHOUT RESULT (effort HIGH, amber), RESULT WITHOUT EFFORT (result WIDE, cyan), QUIET BAR (effort LOW and result NARROW), ORDINARY BAR, or BASELINE BUILDING.
- FORMING BAR (time left on the right, e.g. 27:00 left): VOLUME PACE = volume so far / (baseline x elapsed share of the bar), with tier; RANGE SO FAR = range so far / baseline range.
- TORQUE BALANCE (last Torque Balance Window bars): the amber share of the bar is EFFORT-LED bars (effort above result), the rest RESULT-LED. State ABSORBING (65 % or more effort-led), FLOWING (35 % or less), MIXED, or BUILDING.
- LAST SIGNAL: the pattern name, BULLISH or BEARISH, bars ago, and E, R, T and CLOSE of that bar; NO SIGNAL YET when none.
- SIGNAL HISTORY: count of each of the eight patterns over the last History Bars for Signals bars.
Buffers for EAs (iCustom)
0 Torque Cloud Effort (smoothed effort), 1 Torque Cloud Result (smoothed result), 2 Effort, 3 effort colour index (0 LOW, 1 NORMAL, 2 HIGH, 3 ULTRA), 4 Result, 5 Bullish Signal, 6 Bearish Signal (arrow levels, EMPTY_VALUE otherwise), 7 Signal Code (+1 DRIVE UP, +2 SPRING, +3 ABSORPTION LOW, +4 NO SUPPLY, -1 DRIVE DOWN, -2 UPTHRUST, -3 ABSORPTION HIGH, -4 NO DEMAND, 0 none), 8 Torque. Empty readings are EMPTY_VALUE. Read closed bars (shift 1):
int h = iCustom(_Symbol, _Period, "Market\\Torque Effort Analyzer");
double code[1], eff[1];
if(CopyBuffer(h, 7, 1, 1, code) == 1 && CopyBuffer(h, 2, 1, 1, eff) == 1 && code[0] != 0)
   Print("pattern ", code[0], " effort ", eff[0]);
Alerts
When a pattern appears on the newest closed bar: Pop-up Alert, Sound Alert, Push Notification and Email Alert, each optional, with text like "Torque: SPRING (bullish) on EURUSD H1 | effort 2.10x, result 0.95x". Patterns found in history when the indicator loads do not alert.
Side Effects
Chart objects prefixed TEA_P_ (card) and TEA_M_ (markers), removed with the indicator. A 1-second timer refreshes the forming-bar readouts. No files, no global variables, no DLLs.
Input Parameters
Effort and Result Baseline
- Baseline Mode (Same time of day): Same time of day or Rolling bars.
- Baseline Length (20): days of the same slot, or bars in rolling mode (5-200).
- Min Samples Before Reading (5): 3 up to Baseline Length.
- Volume Source (Tick volume): Tick volume or Real volume (exchange symbols).
- Torque Cloud Smoothing (5): EMA bars of the cloud.
Effort and Result Tiers
- Low Effort Below (0.7), High Effort From (1.6), Ultra Effort From (2.5): x baseline, each above the previous.
- Narrow Result Below (0.7), Wide Result From (1.4).
Signals
- Context Bars (20): bars for new high/low and range position (3 or more).
- DRIVE UP / DRIVE DOWN Signals, SPRING / UPTHRUST Signals, ABSORPTION LOW / HIGH Signals, NO SUPPLY / NO DEMAND Signals (all true): switch each family on or off.
- Absorption Torque From (2.0): above 1.
- Min Bars Between Identical Signals (3): 0 = no spacing.
Drawing
- History Bars for Signals (3000), Signal Markers on Price Chart (true), Max Markers Drawn (80).
- ATR Period (14): marker distance from the candle (0.6 ATR).
- Window Maximum (4.0): 0 or 1.5 and above.
- Bullish Color, Bearish Color.
Telemetry Card and Alerts
- Show Telemetry Card (true), Start Collapsed (false), Card Scale (1.0, 0.5-2.5), Torque Balance Window (20, 5-500).
- Pop-up Alert (true), Sound Alert (false), Push Notification (false), Email Alert (false).
Typical Setups
- Intraday FX and gold (M5-H1): defaults.
- Fewer, stronger signals: High Effort From 2.0, Wide Result From 1.6, Min Bars Between Identical Signals 6.
- Exhaustion only: keep SPRING / UPTHRUST and ABSORPTION, switch DRIVE and NO SUPPLY / NO DEMAND off.
- Stocks and futures with exchange volume: Volume Source = Real volume, Baseline Length 30.
Notes
- Tick volume counts price changes, not traded lots; it tracks activity well on FX and CFDs.
- After a holiday or a session-time change a slot may compare against fewer normal days for a while.
- Works on any symbol and timeframe, in the Strategy Tester and with iCustom.
Risk Disclaimer
Trading forex and CFDs on margin carries a high risk of loss. Past or simulated results do not guarantee future results. This indicator does not trade and does not promise profit.