BBF Cycle 4
- Experts
- Version: 4.0
- Activations: 5

BBF Cycle 4.0 is a fully automatic trading system for MetaTrader 5. It runs a portfolio of four instances of the same strategy logic on eight forex symbols from a single chart. It does not use grid, martingale or averaging down. This page describes what the EA does, what it does not do, how it was verified over 23.5 years of data, and what its losing periods look like. Detailed marketing material is deliberately absent; the goal of this description is that you know exactly what you are running before you run it.
PORTFOLIO STRUCTURE
The first generation of BBF Cycle traded a single strategy engine. Version 4.0 runs four engines of the same logic in parallel, each on its own currency pair, with one engine deliberately weighted at half size. The entry logic is unchanged from the first generation; the portfolio exists for diversification. In the backtest, the one calendar year in which the single engine lost money was absorbed by the other engines.
Each engine works on two symbols: an anchor pair that it trades directionally, and a second related pair used by the recovery process. The four anchor pairs are USDJPY, EURJPY, AUDJPY and GBPJPY. This is why the EA needs eight symbols in total (see REQUIREMENTS).
All engines are managed from one chart. You do not attach the EA eight times; you attach it once.
WHAT IT DOES NOT DO
- No grid.
- No martingale.
- No averaging down. The EA never adds volume to a losing position and never increases lot size to force a recovery.
- No hidden position accumulation. In the full 23.5-year backtest the maximum number of simultaneously open positions was 8 (one per symbol).
- No external services. The EA makes no web requests, uses no DLL and needs no files besides the single EX5. The three indicators it uses are compiled into the EX5 as resources.
Many published systems produce a smooth equity curve by carrying large hidden floating losses. BBF Cycle is built the opposite way: losses are taken while they are small, then worked back. The equity curve is less smooth day to day, and the loss statistics below are published so you can see that for yourself.
HOW A CYCLE WORKS, IN PRINCIPLE
1. An engine takes a directional position on its anchor pair.
2. If the trade works, profit is secured with a trailing exit.
3. If the trade does not work, the position is cut while the loss is still small and predefined.
4. After a cut, the recovery process works to earn the loss back on the engine's second symbol, with its own strict stop. Recovery attempts are limited in number and in time; if they fail, the engine accepts the loss and returns to normal operation.
The exact entry conditions and distance parameters are intentionally not disclosed and are not exposed as inputs. They are identical for every buyer and identical to the values used in every backtest and live account shown here. What you see in the published results is what the EA runs.
RISK SIZING AND THE DRAWDOWN THROTTLE
Two sizing modes are available:
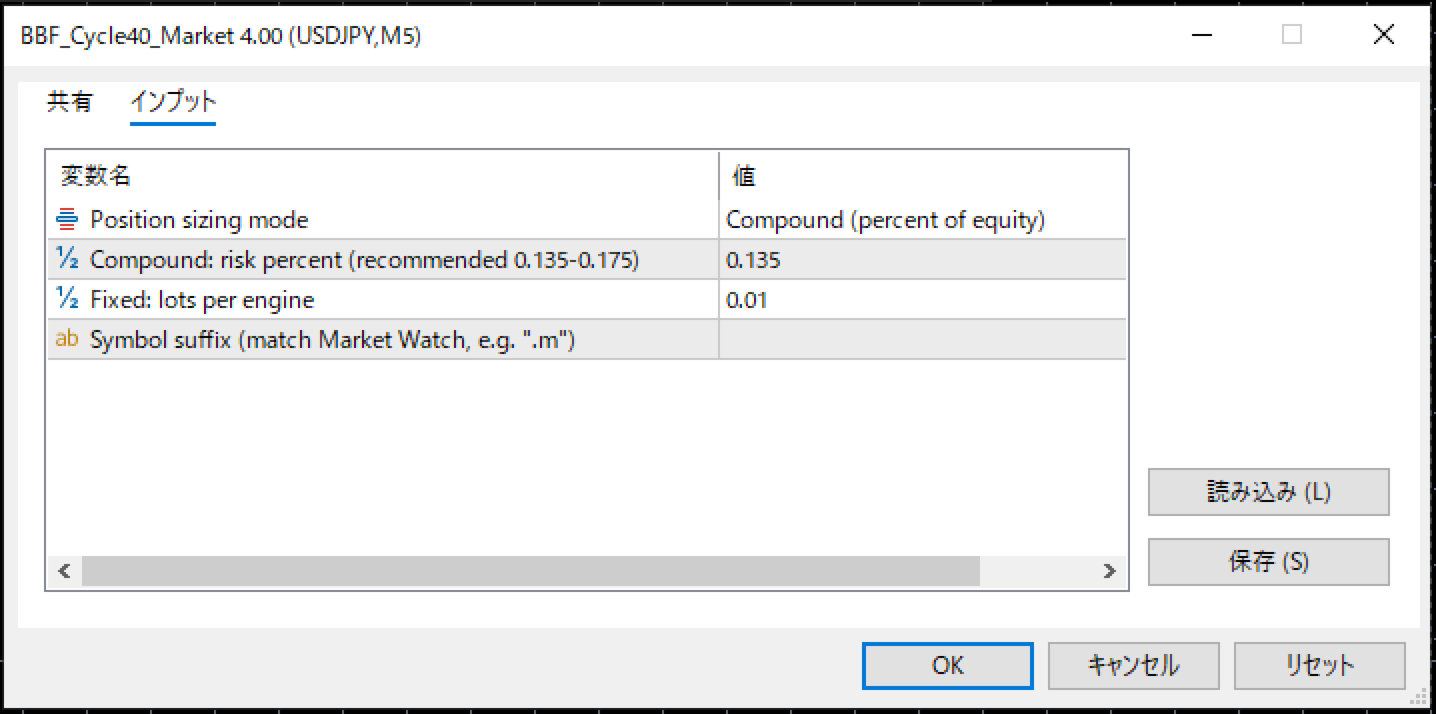
- Compound (default): lot size is derived from a percentage of account equity, so position size grows and shrinks with the account. The recommended risk band is 0.135 to 0.175. The default is 0.135, the setting used for the headline backtest figures below.
- Fixed lots: every engine trades a constant lot size that you set. In fixed mode the half-weight allocation does not apply; all engines use the same lot.
An account-level drawdown throttle is built in and always active in compound mode. When account equity falls below its recorded peak, position sizing is reduced progressively - the deeper the drawdown, the stronger the reduction - and it returns to normal as equity recovers. This is a damping mechanism, not a stop; it reduces the pace of losses in bad phases, it does not eliminate them.
BACKTEST METHOD
- Period: 23.5 years, January 2003 to June 2026.
- Data: 1-minute historical data, eight symbols, synchronized.
- Costs: fixed spread and deliberately unfavorable swap assumptions.
- Account: JPY-denominated, leverage 1:500.
- The same compiled logic produced every figure on this page. No parameter was fitted per year or per report.
Backtests are simulations of the past. They are published as verification material, not as a promise of future results.
BACKTEST RESULTS (compound mode, default risk 0.135)
Starting balance 1,000,000 JPY, 23.5 years:
- Annualized return (CAGR): 31.8 percent.
- Maximum drawdown: 9.07 percent (equity-relative).
- Profit factor: 1.26. About 41,000 trades.
Starting balance matters, because the minimum lot step (0.01) puts a floor under risk on small accounts:
- 100,000 JPY: maximum drawdown 12.34 percent. Inside the whole recommended risk band the drawdown stays pinned at this floor; only the return changes.
- 200,000 JPY and above: maximum drawdown returns to the 9 percent region - measured 8.69 percent at 200,000 JPY, 8.85 percent at 300,000 JPY, 9.08 percent at 500,000 JPY and 9.07 percent at 1,000,000 JPY.
Practical reading: 100,000 JPY is the minimum sensible balance, 200,000 JPY or more is recommended.
Measured by calendar year (fixed-lot yearly tests), the 4.0 portfolio was profitable in all 24 years of the backtest, including 2008 and 2020. Read this carefully: it is a diversification effect, not invincibility. The single-engine first generation lost about 4.4 percent in 2010; in 4.0 the other engines absorbed that year. A historical all-positive record is not a promise of future all-positive years.
WHAT LOSING LOOKS LIKE
From the same 23.5-year backtest (default setting, 1,000,000 JPY):
- 41.5 percent of trading days ended negative.
- 22 percent of months ended negative (62 of 282 months).
- The worst month was about -6 percent.
- The longest losing streak was 3 consecutive months.
- Measured on the fixed-lot run, the longest period in which the balance failed to exceed its previous high was about 8 months (April to December 2019).
If a system description does not tell you numbers like these, it does not mean they do not exist. Expect losing days, weeks and occasionally losing quarters while using this EA.
CONCENTRATION RISK
The four anchor pairs all involve the Japanese yen, and the engines tend to hold exposure on the same side of the yen at the same time. In the backtest, the combined net notional reached roughly 2.5 times account equity at peaks, as in the sharp yen moves of 2022. A sudden, violent yen rally would move against all engines at once. This is the main concentration risk of the strategy and it is disclosed deliberately.
LIVE VERIFICATION
The strategy family follows a fixed verification sequence: backtest, then demo forward test compared against the backtest of the identical period (the comparison is on the shape of the equity curve; live results and backtests never match to the last unit), then a real-money account. A live real-account signal for BBF Cycle 4.0 is published on MQL5 under the name BBF Cycle, so the live behavior of this exact logic can be inspected at any time. The signal account deliberately started small; its purpose is a verifiable public record, not an impressive balance.
INPUT PARAMETERS
The EA has four inputs. Everything else is fixed inside the EX5 on purpose, so that every user runs the verified configuration.
- Sizing_Mode (default: Compound). Selects compound sizing or fixed lots.
- Risk (default: 0.135). Compound mode only. Percentage figure used to derive lot size from account equity. Recommended band 0.135 to 0.175. Higher values increase both return and drawdown; values above the band are outside the published verification and not recommended.
- Fixed_Lots (default: 0.01). Fixed mode only. Lot size per engine.
- Symbol_Suffix (default: empty). Set this if your broker's symbol names carry a suffix (for example ".m" or ".c"), so that the base name plus suffix matches the name shown in your Market Watch. This single value is applied to all eight symbols.
REQUIREMENTS
- MetaTrader 5 with a hedging account. A hedging account is required, because an engine and its recovery leg can hold positions at the same time. On a netting account the platform would merge them, so netting accounts are not supported.
- Eight forex symbols must be visible in Market Watch: the four anchor pairs USDJPY, EURJPY, AUDJPY and GBPJPY, plus four further pairs used by the recovery process. The EA prints the exact symbol names it needs in the Experts tab at startup, and the installation guide supplied with the product lists all eight.
- Attach to one chart only. The verified configuration is a USDJPY chart on M5; the EA manages its symbols and timeframes internally, so the chart it sits on does not change what it trades.
- Minimum balance 100,000 JPY or equivalent; 200,000 JPY or more recommended (see BACKTEST RESULTS for why).
- Development and all published verification were done on JPY-denominated accounts.
- Algorithmic trading enabled in the terminal.
- Continuous operation matters for this strategy; a VPS or an always-on PC is recommended.
- No DLL, no web requests, no external files.
At startup the EA prints one line per engine to the Experts tab. If a symbol cannot be initialized, the EA reports the symbol name and stops instead of trading a partial portfolio.
LIMITATIONS, STATED PLAINLY
- The strategy holds positions through the night and across weekends. Swap costs are part of the backtest (with unfavorable assumptions), but gaps can and will occur.
- Compound curves over two decades produce large end figures. Do not extrapolate them: as equity grows, broker lot limits and liquidity flatten the late part of any compounding curve. The published percentages and drawdowns are the meaningful part.
- Backtest fill assumptions differ from live fills. Live commissions on some account types are higher than the backtest assumption; on a small account this is measurable.
- The EA does not have a news filter and does not stop trading around announcements; the published statistics include all such periods.
- This is not a system that wins every month. See WHAT LOSING LOOKS LIKE.
FREQUENTLY ASKED QUESTIONS
Does the EA use grid, martingale or averaging down?
No. Losses are cut small and worked back by a bounded recovery process. Lot size is never increased against a losing position.
Can I run it on one pair only, or change the pairs?
No. The portfolio composition is fixed and is part of the verified design. Removing engines would reproduce neither the published returns nor the published drawdowns.
Which chart do I attach it to?
One chart. The published verification used a USDJPY chart on M5, so that is the configuration to reproduce. The EA trades its eight symbols regardless of the chart it is attached to.
Does it work on a netting account?
No. A hedging account is required. An engine and its recovery leg can be open at the same time, and a netting account would merge them into one aggregated position.
Can I change the entry parameters?
No. The strategy parameters are fixed inside the EX5 so that every user runs exactly the configuration that was backtested for 23.5 years and runs on the live signal account.
What happens if my terminal or VPS goes offline?
Open positions keep their server-side stops. Trailing, cuts and new entries stop while the terminal is offline. Run the EA on a VPS if you cannot keep the terminal online.
Why did the EA not open any trade yet?
The strategy is selective; days without a new position are normal. Check the Experts tab: after a successful start it prints four engine lines. If initialization failed, the log names the symbol to fix (usually the suffix).
Is the live record public?
Yes. A real-account MQL5 signal named BBF Cycle runs this exact version. Its full trade history is visible there.
What deposit currency should the account have?
All published verification is on JPY accounts. If you run a different deposit currency, test on a demo first and size conservatively.
VERSION
4.0 - First public release of the four-engine portfolio version. The strategy core is the verified first-generation logic; 4.0 adds the portfolio structure, half-weight allocation and the account-level drawdown throttle as a single self-contained EX5.