Watch the Market tutorial videos on YouTube
How to buy а trading robot or an indicator
Run your EA on
virtual hosting
virtual hosting
Test аn indicator/trading robot before buying
Want to earn in the Market?
How to present a product for a sell-through
Expert Advisors and Indicators for MetaTrader 5 - 168

European Kamikaze is a specialized algorithmic trading system designed exclusively for the EURJPY , GBPJPY , AUDJPY , CADJPY and USDJPY on 3-minute charts, but best results is for EURJPY. Position sizing is dynamically calculated based on user-defined risk parameters, while a fixed stop-loss mechanism is applied to all trades. Key Features Instrument/Timeframe Specific : Optimized for EURJPY on 3-minute charts Risk Management : Position sizing based on account balance percenta

Horse Rider — A Simple Trend-Following EA for Swing Trading
No martingale. No arbitrage. No grid. No high-frequency trading. This expert advisor offers a clean, focused approach to trend-following without unnecessary complexity.
Horse Rider is designed for swing trading, emphasizing large wins and controlled losses. Its foundation is built for adaptability and consistency across varying market conditions.
While originally developed with prop firm environments in mind, Horse Rider suits a wid
Expert Advisor Description This scalper is based solely on price action logic — without using hedging, martingale, grids, or other high-risk methods.
Trades are opened based on candle formations and key support/resistance levels. The EA has shown stable and profitable results during long-term backtesting from the year 2000 up to the present. Full backtest statistics are available in the attached report — including a Profit Factor of 2.70 , Recovery Factor of 16.20 , over 94% winning trades, and

AI Trading Dashboard - Retracement Signal Indicator for BOOM & CRASH Plaese Leave Review OVERVIEW
Technical analysis indicator for BOOM, CRASH synthetic indices. Monitors daily trends and identifies retracement entry points based on configurable parameters.
KEY FEATURES
Signal Generation • BUY signals on BOOM indices during uptrend pullbacks • SELL signals on CRASH indices during downtrend bounces • Adjustable retracement threshold (default: 10 pips, can set to 20-30+ pips) • Signal cooldow

TrailNow Ghost EA - Advanced Client-Side Trailing Stop Utility
Overview TrailNow Ghost EA is an advanced MetaTrader 5 utility tool that implements sophisticated client-side trailing stop functionality without modifying server-side stop loss orders. This innovative approach provides traders with enhanced control over position management while maintaining compatibility with various broker environments and trading strategies. Core Functionality Ghost Trailing Stop System The EA operates using a "g

Neo Hulk is a user-friendly and powerful Expert Advisor (EA) for MetaTrader 5 (MT5), designed to make automated trading simple, reliable, and effective. Perfect for traders of all levels, Neo Hulk combines advanced trading strategies with easy-to-use settings, allowing you to trade multiple markets with confidence. Whether you're new to trading or an experienced professional, Neo Hulk helps you automate your trades while keeping risk under control. Visit Neo Hulk LP . Key Benefits Beginner-Frien

SmartEntry Signal is a custom indicator that provides accurate Buy and Sell signals based on dynamic market behavior. The indicator uses internal filters and price logic to detect potential entry points and marks them with visible arrows on the chart.
Features: - Buy/Sell arrows appear directly on the chart - Non-repainting signals - Designed for scalping and short-term trading - Works on any timeframe and symbol - Simple and intuitive interface
Recommended Use: - Timeframe: M15, M30 or

General Idea of the Strategy This robot is built on a simple yet powerful concept .C apturing high-probability trend reversals by combining three essential market elements: Moving Average (MA) : to identify the dominant trend and areas of excess. Price Elasticity : to detect when the market moves too far from its natural balance. RSI (Relative Strength Index) : to confirm overbought or oversold zones before a potential reversal. This combination allows the robot to enter trades only when condi

Have you ever entered a breakout trade, only to watch the market instantly reverse and wish you had taken the opposite side?
MultiFX FadeEdge is designed specifically for this frustrating scenario. This intelligent EA is built to identify potential range breakouts and instantly assess whether the move is genuine or a fake breakout . When a fakeout is confirmed, the bot fades the breakout and places a trade in the opposite direction , turning market traps into profit opportu

小宝交易AssistantX 功能介绍 小宝交易AssistantX 是一款简洁实用的交易辅助工具,聚焦核心功能。以下是主要功能介绍: 平仓功能
支持手动或自动平仓,截图中的“平仓 Close”按钮让您随时结束交易,减少损失或锁定利润。 下半日功能
提供下午交易数据分析,如 D1 和 D+ 时间框架,帮助您掌握下半日市场趋势。 自动止盈
系统根据设定自动止盈,截图“止盈 +50%”显示可自定义目标,保护盈利。 技术指标支持
集成 SMA(如 10 周期 0),助您判断买卖时机。 风险管理
止损设置如“止损 -25%”,控制风险,保障资金安全。 自动交易
支持预设条件自动买卖,“买入 10000”体现自动化便利。 自动止盈,相关功能
这款工具简单高效,适合各类交易者使用!
Universal Volatility Compass (UVC): Navigate Market Cycles with Confidence Across All Assets Since its introduction in 1993, the CBOE Volatility Index (VIX) has become the go-to measure for market risk and investor fear in the stock market. High VIX readings signal heightened volatility and often coincide with market bottoms, while low readings suggest complacency and market tops. But what about the vast universe beyond the S&P 500, Nasdaq, and Dow? Commodities, forex, cryptocurrencies, even ind

XAU Breakout Pro – The Ultimate GMT Gold Breakout Bot Timeframe: M5 Symbol: XAUUSD ️ Type: Fully Automated Expert Advisor Strategy Style: Volatility Breakout
Why XAU Breakout Pro? XAU Breakout Pro is engineered for precision, speed, and profitability. It captures high-volatility breakout moves that occur during the London market open — one of the most explosive times to trade gold (XAUUSD).
This EA doesn’t overtrade. It waits patiently for the right moment, then strikes with a cle

# DailyEAv3 Professional Trading Expert **Ultimate Daily Trading Solution** | **Version: 3.13** | **Activations: Unlimited**
## Daily3 Smart Trading Expert v3.13 ### The Ultimate Professional Daily Trading Solution Transform your daily trading with the most advanced Expert Advisor on MQL5! Professional-grade tool implementing intelligent money management with bulletproof stability and zero log spam.
---
## Why Choose Daily3 Expert?
### Professional Implementation - **Zero

LONDON EDGE – GBPUSD M30 Scalping Expert Advisor LONDON EDGE is a structured Expert Advisor built for GBPUSD on the M30 timeframe. It uses a consistent logic framework with fixed Stop Loss and Take Profit values. Position sizing adjusts automatically based on account balance. No martingale, grid, or hedge methods are used. Live Signal
https://www.mql5.com/en/signals/2313088
This EA is suitable for prop firm use, meeting strict risk control rules and low drawdown requirements through disciplin

KasTon Magic OSI: The Ultimate Trend Confirmation Oscillator Double-Confirm Your Trading Decisions and Enter the Market with Confidence! Are you tired of entering trades too early, only to see the market reverse on you? Do you struggle to determine if a new trend has real strength or if it's just market noise? To answer all these questions and take your trading to the next level, we have created the KasTon Magic OSI (Oscillator) . This is not just a simple oscillator; it is a powerful decision-

Unlock the Power of Systematic Trend Following The Price Action Breakout Maven EA is a sophisticated automated trading system that captures powerful market trends through proven breakout methodology. Based on Richard Donchian's legendary trend-following strategy, this EA has been optimized for modern markets with advanced risk management and multi-timeframe analysis. Why Choose Our Donchian Channel EA? Proven Strategy: Based on the turtle trading system that made millions Advanced Featur

KasTon Trend System: The Complete 2-in-1 Trading Strategy
Identify the Trend, Confirm the Signal, and Trade with Confidence! Do you suffer from confusion while trading? Do you find it difficult to determine the market's direction? Are you tired of losing money on false signals? The KasTon Trend System is here as an integrated solution to all these problems. This is not just an indicator; it is a complete trading strategy built on the synergy of two powerful, custom-built indicators. Our main g

NeuroPrompt is an intelligent Expert Advisor that integrates AI models (via OpenAI) to analyse the market and provide trading decisions.
It collects live market data, sends it to ChatGPT through the API, receives the AI’s response, and then executes the decisions automatically in MetaTrader 5. Key Inputs & Settings AI Model and API Settings:
GPT model – Choose between GPT 4 or GPT 5 . Your API key – Your OpenAI API key (required to connect to the AI). Working time frame – Timeframe the EA ope

AI Ultra XGold Pro is a next-generation Expert Advisor (EA) designed to intelligent automation to your gold trading strategy. Powered by an advanced AI prediction model, this EA continuously analyzes market conditions. Optimized specifically for XAUUSD (Gold) on H1 Timeframe By default, the EA allows multiple orders at a time. These trades are not part of a grid or martingale strategy — each order is independent and protected by a fixed Stop Loss and Take Profit.
Features - Fully Automated Tr

Product Description This powerful and flexible Expert Advisor seamlessly connects to any custom indicator by referencing its buffers, supporting up to eight indicator input parameters and multi-timeframe signals. Advanced trade management options allow for instant execution or sophisticated pending order strategies with dynamic offset and expiry controls. The EA also features robust money management tools, including fixed or dynamic lot sizing, risk–reward targeting, and multiple stop-loss/ta
ADX HEDGE MASTER Advanced Hedging & Trend Following EA Revolutionary Trading Solution for Maximum Profit Potential The ADX HEDGE MASTER is a sophisticated Expert Advisor designed to dominate the forex market through intelligent hedging strategies combined with precision trend-following algorithms. This cutting-edge EA leverages the power of the Average Directional Index (ADX) to identify optimal market conditions while executing dynamic hedging positions for consistent profitability.
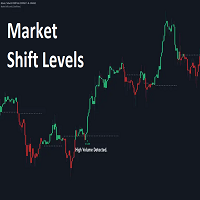
Market Shift Levels
This indicator detects trend shifts and visualizes key market structure turning points using Hull Moving Average logic. It highlights potential areas of support and resistance where price is likely to react, empowering traders to spot early trend transitions.
Market Shift Levels are horizontal zones that mark the moment of a directional change in market behavior. These shifts are based on crossovers between two smoothed Hull Moving Averages (HMA), allowing the indicator

ICT Unicorn Model EA is a fully automated trading system designed around a high-probability smart money concept known as the Unicorn Model . This model leverages a precise confluence between two powerful price action phenomena: breaker blocks and fair value gaps (FVGs) . The strategy identifies moments where a breaker block, formed after a liquidity sweep and market structure shift, aligns perfectly with a nearby fair value gap. This overlapping zone acts as a high-probability area for reversals

GBPUSD indicator.mq5 – Smart Signal Arrow Indicator Mark.mq5 is a professional-grade, fully autonomous signal indicator designed for serious traders who want visual, consistent trade signals with smart logic and advanced filtering. Built for GBPUSD M15 , it generates Buy , Sell , Buy Stop , and Sell Stop signals using a custom combination of Alligator (Lips) , RSI , DEMA , and DeMarker indicators — and it even writes signal data to a .csv file for automation or external trade management. K

Version: 1.0 Platform: MetaTrader 5 Type: Trend / Crossover Signal Indicator Overview
The Custom SMMA Indicator is a specialized trend-following tool designed for traders seeking early entry signals based on the interaction of two smoothed moving averages. Inspired by the principles of the Alligator indicator, this tool visualizes dynamic shifts in market direction through visual crossover signals on the chart. Key Features
Buy and Sell Signals: Clearly plotted arrow markers indicate potential

Gold Spotter AI – Intelligent Trend Detector & Trade Executor for XAUUSD Gold Spotter AI is a powerful and adaptive Expert Advisor designed for gold (XAUUSD) trading. It leverages advanced trend analysis to automatically execute trades and manage risk with minimal user intervention.
Users can also maximize profits by setting the take profit to 10,000 points (equivalent to 100 pips ), allowing the AI to ride stronger trends for bigger gains while still managing exits through intelligent trend

9 0% limited time discount! (original price $25,000.00)
Until 1.1.2026.
Take the opportunity. Trade Smarter.
AI-Powered Gold Trading EA - Advanced ML & OpenAI Consensus System The Future of Automated Gold Trading is Here! Transform your XAUUSD trading with the most sophisticated AI-powered Expert Advisor ever created. This isn't just another EA - it's a revolutionary trading system that combines Machine Learning, OpenAI GPT intelligence, and advanced market analysis to make

AetherBlade EA - Smart XAUUSD Trading on Autopilot AetherBlade is a fully automated Expert Advisor built exclusively for XAUUSD (Gold) on the H1 timeframe . It leverages intelligent price behavior to identify high-quality entries with a smart dynamic risk-reward model.
Key Benefits Designed only for XAUUSD (supports symbols like XAUUSDm , XAUUSD.pro , etc.) No grid, no martingale: Purely logical, high-probability trades Automatic lot sizing based on account equity Break-even stop loss adjustmen

Quantum Trend Fusion EA – Unleash the Power of Hybrid Intelligence in Trading Quantum Trend Fusion EA is a next-generation, all-in-one Expert Advisor built for serious traders who demand accuracy, adaptability, and results. Powered by a fusion of trend-following logic, reversal detection, dynamic filtering, and smart money concepts, this EA is engineered to capitalize on high-probability setups across all major sessions with minimal human intervention. Core Logic Breakdown: Double Moving Avera

Breakout King EA – P ure price action breakout logic, combined with strict risk management Breakout King EA is a fully automated trading system developed for MetaTrader 5, designed to identify and trade breakout opportunities using price action logic. This EA was originally developed for personal use and has been tested under live market conditions. Based on its performance and stability, it is now made available on the MQL5 Market for other traders who prefer structured breakout trading with

CandleSniper EA – Master Precision Reversals with Candlestick Power! CandleSniper EA is a powerful, precision-engineered Expert Advisor built to capitalize on reversal patterns using the highly trusted Hammer and Shooting Star candlesticks. This EA is designed for traders who demand accuracy, smart risk management, and clean execution – no messy indicators, no unnecessary signals, just pure price action power. Why CandleSniper EA? Pure Price Action Strategy – No indicators, just clean candl

Indicator used: Bollinger Bands Only The minimum deposit is 10,000 cents or 10,000 dollars or more.
No curve fitting. No Artificial Intelligence. Any Symbol XAUUSD:GOLD Recommended Any Time 100USD Strat 200USD Next Maximum 2000USD 「schedule」
input int StepPoint1 = 200; 3Digit→2000 input int StepPoint2 = 200; 3Digit→2000 input int StepPoint3 = 200; 3Digit→2000 input int MaxOrders = 10; input int MaxSpread = 20; 3Digit→200

PROSHIELD DYNAMICS Premium Trend Following Expert Advisor Transform Your Trading with Advanced Protection & Dynamic Performance PROSHIELD DYNAMICS is a sophisticated trend-following Expert Advisor designed to deliver consistent profits while safeguarding your capital with military-grade protection systems. This isn't just another EA – it's your personal trading fortress that adapts to market conditions and maximizes opportunities across multiple timeframes. ️ Why Choose PROSHIELD DY

Raw Tick Recorder EA for MetaTrader 5 For full setup instructions and demo version that works on chart (not just Strategy Tester), visit: Full User Guide – Raw Tick Recorde r Raw Tick Recorder EA is a lightweight utility that captures every tick from your broker's price feed in real time. It records bid/ask data with millisecond accuracy and exports to multiple formats, including .csv, .bin, and .bi5 . This EA does not send, modify, or manage orders. It only listens and writes data. Ideal for
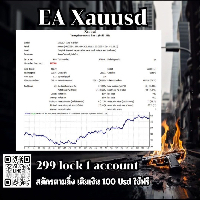
Automated Gold Trading System (Expert Advisor for XAU/USD)
This Expert Advisor (EA) is designed exclusively for trading gold (XAU/USD) and operates with 2-digit decimal precision. The system supports both buy and sell trading strategies, allowing it to take advantage of market movements in either direction.
The EA runs on the H4 (4-hour) timeframe, making it suitable for medium- to long-term trading strategies. It is ideal for traders looking for a more stable and less noisy trading environmen

If you’re constantly finding yourself annoyed by the need to manually disable auto scroll on every single chart window you open, you’re not alone. Many users share this frustration, especially when managing multiple charts during analysis or live trading. Fortunately, there’s a simple solution that can save you from this repetitive task: a handy script designed specifically to automatically disable auto-scroll across all open chart windows in your trading platform. The beauty of this script lies
Overview
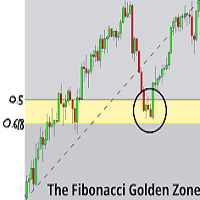
Fibonacci Optimal Entry Zone [OTE] is a high-precision market structure tool designed to help traders identify ideal entry zones during trending markets. Built on the principles of Smart Money Concepts (SMC) and Fibonacci retracements, this indicator highlights key areas where price is most likely to react — specifically within the "Golden Zone" (between the 50% and 61.8% retracement). Figure 1 It tracks structural pivot shifts (CHoCH) and dynamically adjusts Fibonacci levels bas

Atomic Multi-Strategy EA: Your Ultimate Trading Toolkit Welcome to Atomic, the most versatile and powerful trading automaton for MetaTrader 5. I designed this Expert Advisor not just as a single tool, but as a complete trading framework. It's a multi-strategy, multi-symbol powerhouse built on a foundation of sophisticated trade and risk management. Whether you're a trend-follower, a scalper, or a grid trader, Atomic provides the features and flexibility to build, test, and deploy virtually any

Doctor Edge Strategy Pro – Range & Breakout Zones Doctor Edge Strategy Pro is a professional indicator designed to simplify market reading based on range and breakout zones. It combines concepts of Price Action, ICT, and Smart Money Concepts, providing an automated and precise approach for traders of synthetic indices, cryptocurrencies, and Forex pairs. How It Works Doctor Edge Strategy Pro automatically draws on the chart: The range zone (lateral accumulation); The upper breakout zone (gr
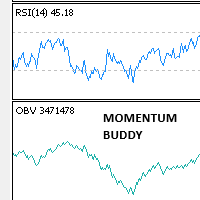
The Momentum Buddy uses momentum shift to identify trading opportunities. When the RSI crosses the 50 level from below, it indicates an upward shift in momentum. This shift is confirmed by the On Balance Volume ( OBV) indicator. A buy order is placed. When the RSI crosses the 50 level from above, it indicates a downward shift in momentum. This shift is confirmed by the On Balance Volume ( OBV) indicator. A sell order is placed. Exits are entirely based on indicator values. The EA works better

Supply Demand Volume Zones — Institutional Support & Resistance levels with Bull/Bear Pressure Supply Demand Volume is a precision tool designed to automatically detect key supply and demand zones based on price structure, volume analysis, and real-time volatility. Built for traders who rely on accurate support and resistance levels, supply and demand order flow, Wyckoff schematics , or Smart money concepts , this indicator offers enhanced insights by showing buy vs. sell Volumes and marking pot

Expert Advisor which monitorizes market with various indicators as CCI, MACD, STOCH, EMA and RSI, it could be configured in it's indicators params, forex symbols, timeframes and schedule operations during the day. Without any symbols or timeframes selected it runs over current symbol and timeframe. It has a risk managment set options and multiplies the fixed lot as the balance increase without convert the account in a casino. If nop is triggered the expert awaits the close of all operations and

This Expert Advisor monitors all open positions across all symbols in MetaTrader 5. Whenever a Stop Loss (SL) or Take Profit (TP) is manually set or adjusted on any position, the EA automatically applies that value to all other open positions , regardless of symbol or order type (Buy/Sell). This ensures consistent and synchronized SL and TP levels across your account.
Perfect for mobile trading via tablet or smartphone!

PRECISION MAVERICK - Advanced Multi-Timeframe Trend Expert Advisor Professional Trend Trading at Your Fingertips PRECISION MAVERICK It's a sophisticated Expert Advisor designed to capture profitable trend movements across major currency pairs with military-grade precision. Built for both novice and experienced traders, this EA combines advanced multi-timeframe analysis with intelligent risk management to deliver consistent trading performance.
Key Features That Set PRECISION MAVERICK Apa

Trinity Shield EA - Multi-Strategy Adaptive Trading System, Built to beat prop challenges! ️ Advanced Protection. Intelligent Trading. Optimized Performance. Prop Challenge KILLER! Trinity Shield EA combines multiple technical analysis strategies with robust risk management in a highly optimized package designed for serious traders. Performance-Optimized Architecture Built with advanced caching mechanisms and intelligent update cycles to minimize CPU usage while maintaining real-time market

London Trap Breaker EA — Smart Reversal Trading at the London Open London Trap Breaker EA is a powerful expert advisor built to detect fakeouts and trap breaks that occur during the London session open . It uses a unique combination of price action, smart range logic, trend filtering, and candlestick pattern recognition to catch high-probability reversal trades — right when the market traps early breakouts . This EA is tailored for the GBPUSD pair on the M1 (1-minute) timeframe and is optimized

XignalCoding Prop Grid EA Build your own strategy. Pass prop firm challenges with confidence. The XignalCoding Prop Grid EA is a highly flexible and powerful trading tool designed for traders who want full control over their strategy, grid system, and risk. Whether you're testing ideas or aiming to pass prop firm challenges like FTMO, this EA gives you the structure and safety you need. Main Features Custom Strategy Creation
Choose your entry signal: RSI, CCI, Stochastic, Williams, Bollinger Ba

AbacuQuant: Trading Algorítmico con "Inteligencia de Enjambre" Deja de apostar. Empieza a gestionar. La mayoría de los robots fallan por la misma razón: dependen de una sola "bala de cañón" (una operación grande) que pone en riesgo toda la cuenta. AbacuQuant cambia el paradigma. No es un simple bot; es un Marco de Trabajo Institucional diseñado para la diversificación interna y la preservación de capital. ¿Qué hace único a AbacuQuant? AbacuQuant utiliza una arquitectura de "Inteligencia de

TrendFusion X is a fully automated trading solution designed for traders who value precision, discipline, and structured decision-making.
It combines a trend scoring model with multi-timeframe analysis and confirmation logic to ensure trades are executed only under technically favorable conditions. Built for modern trading environments, TrendFusion X adapts to changing market behavior and focuses on quality setups rather than volume. Core Features Trend Strength Scoring System Filters out weak

To celebrate the launch of our latest product from "Keyvan Trading Bots" — the “Keyvan Bitcoin Bot,” one of the most powerful and advanced trading robots specialized for Bitcoin — all of our products are now available for a limited time with discounts more than 50%. During this special launch event, the price of the "K1 Gold Bot MT5" has been reduced from $495 to only $197. Don’t miss out — complete your purchase today ! We ARE NOT here to generate profits for brokers with a high number of trad

Master Channel Breaks with the Market's Most Advanced Indicator! The Channel Break X21 is a state-of-the-art indicator for MetaTrader 5, designed for traders looking to maximize profits and minimize risks through precise analysis of channel breaks and trends. With an interactive interface and innovative features, this indicator is the ultimate tool for identifying opportunities in any financial market. What does the Channel Break X21 do? D

Master the London Breakout: Automate Your Edge with GBPUSD Twilight OB EA
GBPUSD Twilight OB EA GBPUSD Twilight OB EA is a robust, precision-engineered Expert Advisor tailored for traders seeking to exploit early London session breakouts. It harnesses a sophisticated blend of range-based logic, advanced order block detection, and price action confirmations to deliver high-probability trade entries. This EA is meticulously optimized for the GBPUSD pair on the M1 timeframe , automatically pinpoin
Pairwise Open Positions Tracker is a lightweight indicator designed to give traders a clear, real-time summary of their all open positions by financial instrument. Ideal for scalpers, day traders, and portfolio managers, this tool displays important statistics including number of trades, total lots, net profit, and swap.
Key Features Live Floating Profit Overview : Instantly shows P/L for each symbol with active trades. Grouped by Symbol : Summarizes positions per instrument, no matter how m

Introducing the Ultimate Gold Trend EA – Built for Precision, Powered by Smart Money Concepts! Do you want to dominate the gold market like a true professional? Meet Gold Trend EA , your all-in-one algorithmic trading powerhouse designed specifically to analyze, adapt, and conquer in volatile gold environments. Whether you're a seasoned trader or just starting out, this EA delivers cutting-edge precision by blending classic technical indicators with the Smart Money Concept (SMC) approach used

A technical analysis tool that displays dynamic price levels on the chart based on market volatility measurements. Technical Features: Calculates 5 distinct price levels displayed as horizontal lines Applies a multiplier factor (default: 6.0) to scale the calculations Features an adaptive central reference line that adjusts based on price movement All levels update dynamically as new price data becomes available Visual Components: Upper Level 2 (Red): Outermost upper boundary Upper Level 1

STFusion Pro — Advanced Multi-Strategy Trading System "The perfect fusion of strategies to maximize your trading." 1. Overview STFusion Pro is an advanced Expert Advisor for MetaTrader 5 that integrates 8 independent technical strategies with dynamic and sophisticated risk management. It is ideal for trading stocks, forex, cryptocurrencies, and futures. Thanks to its multi-strategy approach, it adapts behavior according to market conditions, volatility, and trend, aiming to maximize opportuni

EXPERT PINBANDS This EA uses a strategy that combines Pin Bar signals with Bollinger Bands (BB) .
The key advantage is that it opens and closes positions quickly, as it is designed for M15 time frame .
It works well in trending markets and looks for entry points at potential reversals. Advantages: Fast position entry and exit Designed for M15 time frame Suitable for trending market conditions Limitations: May not perform well in sideways or ranging markets Recommended starting capital:

SPECULATOR is a manual trading system and indicator that helps you identify key support zones and market direction.
Master the market with a simple strategy and hidden wisdom! This is a manual indicator and contains features that may not supported by the MetaTrader current testing environment .
You choose any top and bottom on the chart, and the indicator draws: A support zone for your trend. For a bullish trend, a green zone appears; for a bearish trend, a red one. The support zone's sensitivit

TraderFX Robot — Strategic Intelligence in Every Move The TraderFX Robot is an automated breakthrough in the Forex market. More than just a trading system, it embodies a project driven by efficiency, control, and strategic precision . Built on an enhanced version of the classic moving average crossover strategy , and reinforced with sophisticated market volatility analysis , TraderFX is designed to spot high-potential entry and exit points — even in unstable conditions. It also offers powerf

Unleash Your Trading Potential with IsheguveScalper EA! The Isheguve Expert Advisor is a sophisticated, fully automated trading solution designed to identify high-probability trade setups and manage your positions with precision. Built on robust technical analysis and smart money management principles, Isheguve aims to bring consistency and discipline to your trading journey. What Makes IsheguveScalper Stand Out? 1. Intelligent Money Management & Risk Control: Dynamic Lot Sizing: Autom

The RSI-Based Automatic Buy Strategy Expert Advisor (EA) is designed to automatically open buy positions when the RSI indicator enters the oversold zone. It smartly spaces new trades by maintaining a minimum distance between open positions to prevent excessive exposure. With adjustable take profit (TP) levels and lot sizes, this EA is specifically tailored for the XAUUSD (Gold) pair on the M5 timeframe. This Expert Advisor offers reliable and disciplined trade management for traders who want to

LittleBoy EA Overview (for XAU/USD, M30 timeframe only) LittleBoy EA is an Expert Advisor designed for the XAU/USD (Gold vs USD) pair on the M30 timeframe . It utilizes a grid trading strategy , allowing it to open and manage multiple positions simultaneously in response to market volatility. Main Features: Grid Strategy Logic
The EA can open multiple trades as a group using a pyramiding approach, adapting to market fluctuations. Order Management Controls
Set a maximum number of allowed tr

Ichimoku + Bollinger Bands + LWMA with 3 Partial Take Profits Overview This Expert Advisor (EA) is designed for precision trading using a combination of Ichimoku Cloud , Bollinger Bands , and Linear Weighted Moving Average (LWMA) indicators. It integrates smart trade management , partial take profits , and dynamic stop-loss adjustments for optimized risk management. Key Features Advanced Entry Conditions : Uses Ichimoku (Tenkan-sen breakout above/below the cloud), Bollinger Bands, an

SafeZone Auto Close – Smart Equity Protection Script (MT5) Automatically protects your trading account by closing all positions once your equity reaches a defined profit target or critical loss limit – with optional time filter for trading hours. What This Script Does SafeZone Auto Close is a lightweight yet powerful MetaTrader 5 (MT5) script designed to monitor your equity in real time and instantly close all open positions based on two conditions: Profit Target Reached – Close all positio
RSI-MULTI – Multi-Timeframe Trend & Volatility Indicator Description:
RSI-MULTI is a powerful monitoring tool based on the Money Flow Index (MFI), specifically designed for swing traders . It allows you to analyze trend direction and volatility across multiple timeframes simultaneously , without switching between charts. Thanks to a clear and intuitive visual interface (built-in HUD), MFI-MULTI displays: The trend direction per timeframe , calculated from the average angle of the

Visit Tradinbots4u.com to download this bot and receive a 50% discount The Recovery Master is a precision-engineered system for restoring trading accounts with confidence. Built on the proven zone recovery strategy and safeguarded by a maximum drawdown cap, it prevents runaway martingale behavior while reclaiming the bulk of your trading losses. Past updates introduced powerful support for scalping and rapid-fire strategies without compromising recovery integrity. New updates simplify its usabil
MFI-MULTI – Multi-Timeframe Trend & Volatility Indicator Description:
MFI-MULTI is a powerful monitoring tool based on the Money Flow Index (MFI), specifically designed for swing traders . It allows you to analyze trend direction and volatility across multiple timeframes simultaneously , without switching between charts. Thanks to a clear and intuitive visual interface (built-in HUD), MFI-MULTI displays: The trend direction per timeframe , calculated from the average angle of the MFI’s MA

The Three Soldiers and Crows Scanner MT5 is an indicator specialized in detecting the reversal candlestick pattern “Three White Soldiers” and “Three Black Crows”. Thanks to the input in points ( Point ) on the minimum body of the candles, it guarantees compatibility and reliability on any market (Forex, CFD, stocks, futures, indices, cryptocurrencies…) and on any price scheme (2-, 3-, 4-, 5- or 7-digit). Main features Clean detection: only signals the exact completion of 3 consecutive bullish
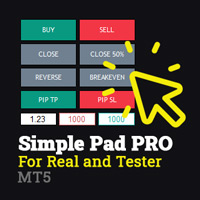
Simple Pad PRO for MetaTrader 5 – Total Control at Your Fingertips Tired of losing valuable seconds when opening or closing trades? Want to trade with the agility of a professional, both in real-time and during strategy testing?
Introducing Simple Pad PRO , the ultimate tool for fast, precise, and strategic trade execution in MetaTrader 5. Designed by traders, for traders , this Pad simplifies manual trading with an intuitive yet powerful interface that works seamlessly on both live charts

Automated trading should make you EARN MONEY, not make you feel like youre studying for a quantum physics exam. Rocket Gold EA is a simple, reliable Expert Advisor designed to help you start trading with confidence from day one.
What maes it special? It best works on XAU/USD: Dont waste time on other pairs; this EA is fully optimized for this symbol. Ready to trade: Just drag it onto the chart and it starts working. Advanced Signal: This robot uses trend market, martingle and hedging stra
Do you know why the MetaTrader Market is the best place to sell trading strategies and technical indicators? No need for advertising or software protection, no payment troubles. Everything is provided in the MetaTrader Market.
You are missing trading opportunities:
- Free trading apps
- Over 8,000 signals for copying
- Economic news for exploring financial markets
Registration
Log in
If you do not have an account, please register
Allow the use of cookies to log in to the MQL5.com website.
Please enable the necessary setting in your browser, otherwise you will not be able to log in.