Watch the Market tutorial videos on YouTube
How to buy а trading robot or an indicator
Run your EA on
virtual hosting
virtual hosting
Test аn indicator/trading robot before buying
Want to earn in the Market?
How to present a product for a sell-through
Expert Advisors and Indicators for MetaTrader 4 - 159

Introducing the ON Trade Numerology Mirror Indicator: Unveiling Reversal Patterns through Numerology Unlock a new dimension in technical analysis with the ON Trade Numerology Mirror Indicator. This innovative tool leverages the ancient wisdom of numerology to identify key price reversal levels on your charts. By rearranging numbers in reversed positions, this indicator reveals hidden patterns that have the potential to signal significant price reversals, giving you a unique edge in your trading
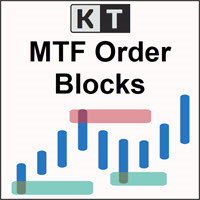
The KT MTF Order Blocks automatically plots the institutional order blocks by using a unique blend of price action with comprehensive multi-timeframe analysis. This advanced approach reveals the area of price reversal, originating from significant buy and sell orders strategically placed by major market players.
Features
Algorithmic Precision: A refined and distinctive order block algorithm meticulously crafted to precisely identify the most pivotal order blocks, often triggering price reversa

Sometimes, the most challenging part after finding a solid strategy is implementing it repeatedly. For that reason, we've developed Gold Hedge Pro , which offers a winning strategy without the need for you to spend hours in front of the chart.
Important! Contact me immediately after purchase, and I'll provide you with the parameters I use!
Very important when testing the EA in the strategy tester. Without these resets, the EA will not function correctly. Lot_Size - Reset to "0.01" Initial Depo

EA Moon Trading is a fully automated trading robot based on Price Action with no lagging indicators. The Expert's simple and effective strategy tracks price and volume movements to trigger trading signals. The EA is programmed with smart and advanced algorithms, it adapts to each currency pair, has all settings optimized and is simple to use. The EA is suitable for currency pairs and Gold. Feature:
+ Fully automated trading 24/5 with time filter. + No need in a large initial deposit. + Alwa

The EA Candle Body SizeX2 strategy is a trading approach that focuses on the size of candle bodies in a price chart. Candlestick charts are a popular tool in technical analysis, used by traders to make decisions about buying or selling assets like stocks, forex, or cryptocurrencies. In the context of the "Candle Body SizeX2" strategy, here's how it generally works: Candlestick Analysis : Candlestick charts represent price movements over a specified period, typically showing open, close, high, an
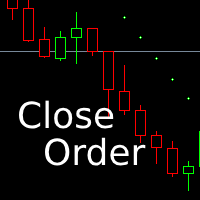
This EA will automatically close all open and pending order when profit or loss is reached according to users setting. Profit or loss can be set by percentage or by amount. When inputting amount for loss make sure to put " - " (minus) sign before the amount. The color of text displayed on the chart can be change in the user input. The text position can also be changed: - left top corner - right top corner - left bottom corner - right bottom corner

Phase10 embodies an advanced grid system that has successfully operated on real accounts. Unlike the typical practice of retrofitting systems to historical data, Phase10 was purposefully designed to exploit existing market inefficiencies. This sets it apart from basic trial-and-error approaches that merely rely on grid strategies. Instead, Phase10 strategically harnesses genuine market mechanics to achieve a consistent monthly profit range of 4-8%, accompanied by low drawdown.
Supported curre

The "EA Envelopes" indicator, often referred to as "Moving Average Envelopes," is a technical analysis tool used in financial markets to identify potential trends and trading opportunities. It consists of two lines plotted above and below a moving average of a security's price. Here's how the Envelopes indicator works: Calculation of Moving Average : A simple moving average (SMA) is calculated for the price of a financial instrument over a specified time period. This moving average represents th

This is an astronomy indicator for the MT4 platform like optuma program that performs a variety of functions. It uses complex algorithms to perform its own calculations, which are so accurate. The indicator has a panel that provides astronomical information such as planets' geo/heliocentric cords, distance of sun/earth, magnitude, elongation, constellation, ecliptic cords, equatorial cords, and horizontal cords depending on the vertical line that generated by the indicator depend on the time va

Buy Sell Scalper - a signal Forex indicator for scalping. It indicates possible price reversal points to the trader. A red dot indicates downward price reversal points, while blue dots indicate upward price reversal points. Recommended currency pairs are EURUSD, GBPUSD, XAUUSD, USDCHF, USDJPY, USDCAD, AUDUSD, EURGBP, EURAUD, EURCHF. Recommended timeframes are M5, M30, H1. The signals from this indicator are also used in the operation of an automated robot: https://www.mql5.com/en/market/product

Introducing the uGenesys Psychological Levels Indicator – Your Key to Precision Trading with Real-Time Alerts! Are you tired of guessing where the market might turn? Do you want a tool that can accurately identify psychological levels and notify you when price touches a key level? Look no further – the uGenesys Psychological Levels Indicator is here to revolutionize your trading experience. Imagine having a tool that not only identifies psychological levels with unmatched accuracy but also aler

Market Position Manager is Expert Advisor that makes very fast executions of orders. First Tab allows you to: Open buy order Open sell order Open sell stop Open sell limit Open buy stop Open buy limit Second Tab allows you to: Put stop loss and take profit Third Tab Allows you to: Set Lot of position Indicator below shows you: Floating profit of open positions made by robot. Application features: Works with any account type and broker Doesnt require specific skills Easy and intuitive interfa
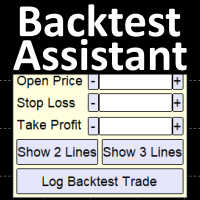
Simplify backtesting by automatically calculate trade outcomes (Profit or Loss) and estimated swap cost based on user-provided open, stop loss, and take profit prices, while also write the data into CSV file and capture before-and-after chart pictures automatically This Backtest Assistant tool is an Indicator, so it works well in coexistence with other expert advisor on the same chart
$30 for the next 25 downloaders, next price: $45 Try Free Trial Version Here: Download Free Trial
Features:
This is an EA that can trade multiple currency pairs simultaneously. One or more of them can be selected through the parameter settings page. If no currency pair is selected, the current chart currency pair will be used for transactions.
The trading strategy uses the moving average as a buying and selling signal, issuing buy or sell orders through the gold intersection. The parameters that have been tested are as follows:
Lots=0.01; (The starting number of open positions, the smaller the valu
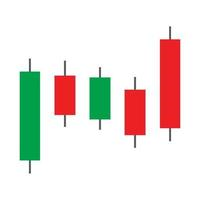
Trend Rider AI is the name of my EA. It operates based on trends, entering trades according to a preset price range until a set profit is reached, at which point it closes all positions.
Live Signal: https://www.mql5.com/en/signals/2179495
Recommended : ・Initial Deposit: 2000$ ・Currency: USDCHF,EURUSD,GBPUSD,USDJPY,AUDCHF,....
Key Parameters for Configuration: ・StepPrice = 10; The distance between two orders is 10 pips. ・ProfitThreshold = 1; When the total profit of either Buy or Sell orders

Golden Bull USES THE TREND WAVE INDICATOR AND IT CAN IDENTIFY THE BEGINNING AND THE END OF A NEW WAVE TREND MOVEMENT. AS AN OSCILLATOR, THE INDICATOR IDENTIFIES THE OVERBOUGHT AND OVERSOLD ZONES. IT WORKS GREAT TO CATCH THE SHORT TERM PRICE REVERSALS AND USES A MARTINGALE STRATEGY TO CLOSE ALL TRADES IN PROFIT. USE DEFAULT SETTINGS ON H1 OR HIGHER TIME FRAME ON ANY PAIR FOR MORE ACCURATE TRADES
WHY THIS EA : Smart entries calculated by 5 great strategies The EA can be run on even a $20000 accou

This is diamond! Contact me to send you instruction and add you in group.
Diamond Pattern is based on Read The Market(RTM) concepts. The purpose of this model is to face the big players of the market (financial institutions and banks), As you know in financial markets, big traders try to fool small traders, but RTM prevent traders from getting trapped. This style is formed in terms of price candles and presented according to market supply and demand areas and no price oscillator is used in it.

Introducing: Order On Time Expert Advisor (EA) Overview :
The "Order On Time" EA is a uniquely crafted tool designed for traders who want precise timing in their order placements. Whether you're looking to capitalize on specific market events or simply have a routine trading strategy, this EA is tailored for you. Features : Phenomenal Profits with Marginal Drawdown : Experience a trading outcome that boasts phenomenal profits while maintaining a very marginal drawdown. Optimized Default Set

An EA Engulfing Candle is a significant pattern in technical analysis often used in financial markets, especially in trading stocks, forex, and other assets. It occurs on candlestick charts and is a reliable indicator of potential trend reversals or continuation. An Engulfing Candle consists of two consecutive candlesticks, usually representing two trading periods (e.g., two days for daily charts). The second candlestick "engulfs" the first one, meaning its body completely covers the body of the

DOWNLOAD FREE DEMO VERSION FROM HERE
The SmartCloseFX Expert Advisor, is a powerful tool designed for traders seeking efficient trade management in the MetaTrader platform. This EA is specifically built to manage trades by automatically closing all open positions except pending orders under specific conditions. The EA monitors the opening of a 0.01 lot pending order (eg. buy stop, sell stop, buy limit, sell limit) on a selected asset. When such an order is placed, SmartCloseFX takes action by c

The EA Ichimoku Cloud consists of several components: Tenkan-sen (Conversion Line) : This is a short-term moving average that indicates the market's short-term trend. Kijun-sen (Base Line) : This is a longer-term moving average that gives insight into the market's medium-term trend. Senkou Span A (Leading Span A) : This forms one edge of the Ichimoku cloud and is calculated by averaging the Tenkan-sen and Kijun-sen. It helps identify potential support and resistance levels. Senkou Span B (Leadin

Alright. This indicator works on MT4 and is very easy to use. When you receive a signal from it, you wait for that candle with the signal to close and you enter your trade at the beginning of the next new candle. A red arrow means sell and a green arrow means buy. All arrows comes with Popup Alert like for easy identification of trade signal. Are you okay with that?
100% non repaint
Work All Major currency Pair,
1 minute time frame 1 minute expire
DYJ PeakAndTrough indicator is an advanced SquareWeightedMA trading system. It includes the future trend line and trend angle and the angle display of each peak and trough.
At the end of the peak of the SQWMA, there is a downward trend, and at the end of the trough of the SQWMA, there is a upward trend. The indicator signal can simulate the opening statistics of trading volume, which makes you have a more detailed understanding of the signal probability. Please download the XAUUSD parameter temp

This EA Optimize for EURUSD H1 With Balance start 1,000 /0.1 Lot Strategy : 1.Used EMA 200 Confirm trend 2.Scan Price action with DOJI 3.Confrim position open order with Stochastic Oscillator EA include 3 money management Mode1 Fix Lot,Fix SL,TP Mode2 Lot Auto exponential ,Fix SL,Fix TP Mode3 Special MM Repeat Order with same logic with Lot martingale Remark : Have Function Closed All , Max order and Cutt loss User can select that you like money management system For my Suggestion is mode

Channel Vertex is a price action pattern formed by price Chanel and a triangle pattern . Price channels basically indicates possible support and resistance zones around a price movement and retracement or breakout at these levels can indicate possible trend continuation or reversal .
Majority of the times price fluctuations forms triangle patterns defined by 3 vertexes , these triangle patterns most times defines a trend continuation. A triangle pattern is a trend continuation pattern that

The " Global Trend Pro Lines " indicator is one of the most important indicators designed to display trading volumes based on the sniper strategy. This indicator provides convenience for daily, medium-term, and long-term traders. The main advantages of the indicator are as follows: Suitable for the sniper strategy: The "Global Trend Pro Lines" indicator is suitable for the sniper strategy and allows traders to identify the best entry and exit points for trading. Displays volumes: The indicator

Deposit from $100.
The expert trades during a small market volatility, at the end of the American session, tracking price levels, and then opens positions
and monitors them until they close with a profit or a small loss. You can limit the number of open positions.
Does not use martingale strategies, averaging positions, waiting out a loss, etc.
All positions are opened with fixed StopLoss, the profit closes on the market itself.
It is possible to use a dynamic lot to increase the volume of
Perhaps you have previously read in technical analysis books about such a concept as "market slope", or "trend slope". Metatrader has such a tool as "trend line by angle". But when working on auto-scaled charts, this tool becomes completely abstract, and as a consequence, useless. The idea of this new parameter, included in the AllAverages_Speed indicator, is to give such a concept as "trend slope" specific numerical values, as well as the further use of the new parameter in work.
Modifica
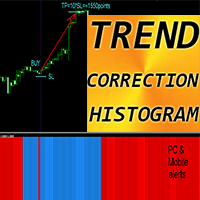
Crypto_Forex Indicator "Trend Correction Histogram" for MT4. Trend Correction Histogram can be in 2 colors: red for bearish trend and blue for bullish one. 7 consecutive histogram columns of the same color means beginning of new trend. Trend Correction Histogram indicator designed with the main purpose - to minimize losses and maximize profit. It has parameter - "Period", responsible for indicator's sensitivity. Built-in Mobile and PC alerts. Trend Correction Histogram can be use as a simple bu
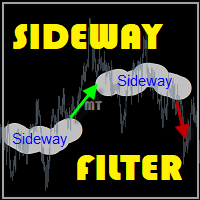
If you know where the sideway,
you will know the trend.
MT Sideway Filter : Built to identify and anticipate sideways market phases. Once detected, expect a transition into a trend, offering profitable opportunities. Ideal for pinpointing both sideways movements and trends. Can be used to enhance the performance of other indicators.
TRADE: Forex TIME FRAME: All Time Frame SYMBOL PAIR: All Symbol
SETTINGS: SIDEWAY FILTER
Period: Put the number period for calculate (1-100) Multiply: Fr

A technical indicator that calculates its readings on trading volumes. In the form of a histogram, it shows the accumulation of the strength of the movement of the trading instrument. It has independent calculation systems for bullish and bearish directions. Works on any trading instruments and time frames. Can complement any trading system.
The indicator does not redraw its values, the signals appear on the current candle.
It is easy to use and does not load the chart, does not require addition
DYJ SuperMATrend is a highly accurate MA trading system.
This indicator marks Bull line segment color (green) and Bear line segment color (red) on the average line. The entrance time and price are the candle time and price at the junction of the green and red lines. The next entrance is the exit point of the previous order.
Input
inpPeriod = 50 inpAtrPeriod = 5 InpLineWidth = 3 clr_buy = clrSpringGreen clr_sell = clrRed InpMup = 40

DOWNLOAD FREE DEMO VERSION FROM HERE
**TradeMonitorPro Expert Advisor**
The TradeMonitorPro Expert Advisor is a powerful tool designed to help you effectively monitor and manage your trading activities in the forex market. This EA offers a range of useful features that allow you to keep track of your open trades, floating daily gains and losses (floating drawdown), as well as margin levels and the volume of open lots. For a correct counting of the Trading Volume, enable the complete history in

The CatchTheWave Expert Advisor for Forex is a software designed to automate trading on the foreign exchange market in real time. This Expert Advisor uses many different strategies to determine the most accurate entry points into the market. Thus, he can apply the most advanced technical indicators and market analysis based on previously made transactions.
One of the key features of " CatchTheWave " is the use of a grid when trading. This means that the Expert Advisor creates orders at various

ZIWOX TRADE LIST Description:
Feeling weary with your small screen? and you need to close your trade list tab to have a larger perspective of chart? Require better management of your trade list? such as win rate, risk/reward ratio? Its a simple tools, but usefull. consolidate your trade list, active positions, opened positions and pending orders onto a distinct chart embellished with refined visuals. It contains with a lots of usefull information.
Feautures: List your trades and positions sort

Introducing the "Magic Trades" for MetaTrader 4 – your ultimate tool for precision trading in dynamic markets. This innovative indicator revolutionizes the way you perceive market trends by harnessing the power of advanced analysis to detect subtle changes in character, paving the way for optimal trading opportunities.
The Magic Trades Indicator is designed to empower traders with insightful entry points and well-defined risk management levels. Through its sophisticated algorithm, this indicato

GU Spot is a One Shot One Kill EA. A Scalping EA for GBPUSD . No Martingale, No Averaging, No Grid or other high-risk strategies. Working with up to the best 100 trading signals algorithm from various Trading Systems. The combination of Price Action, High Low, Trend, Range Levels, Pullback / Retracement and Reversal. This is Fully Automatic Trading Robot . High Accuracy Entry Signals and protected by a proper Money Management. A tight Stop Loss with SL:TP ratio 1:3 by default, Trailing an

This EA Scalping is a trading strategy where traders aim to make small profits from frequent, short-term price fluctuations in the market. It involves opening and closing positions within a very short time frame, sometimes even within seconds or minutes. Traders who employ scalping strategies often make numerous trades throughout a trading session, aiming to capture small price movements. Expert Advisors (EAs) are automated trading systems that can execute trades on behalf of traders based on pr

Xuanjilong EA is another fully automatic EA of mine, specializing in gold. The Expert Advisor performed well on the H1 timeframe for the period 2019-2023. The Xuanjilong EA is based on several trading indicators: RSI (Relative Strength Indicator), Stochastic Oscillator and my own custom indicator to make it more efficient. As an initial signal to determine a suitable entry point, the EA uses 2 levels of standard crossovers: overbought and oversold zones, stochastic and my indicator to determine
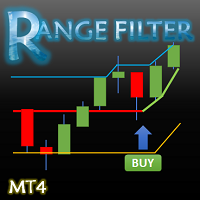
This indicator converted from 5 min Buy and Sell Range Filter - guikroth version on TradingView Popularity of the Range Filter
The Range Filter is a very popular and effective indicator in its own right, with adjustments to the few simple settings it is possible to use the Range Filter for helping filter price movement, whether helping to determine trend direction or ranges, to timing breakout or even reversal entries. Its practical versatility makes it ideal for integrating it's signals into a

Almost all of our advisors have a built-in system of remote adjustment to current market conditions, this process is also called optimization. The settings are transmitted via files that we receive as a result of optimizing our advisors. These are the files that we use in trading on our accounts, so our settings will be the same. This is an analogue of standard .set files, only they are loaded into the advisor code not manually, but automatically directly from our server, via the Internet.
Th
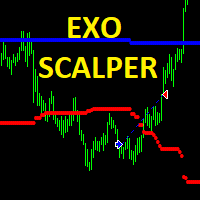
Enter a Novel Phase of Forex Trading with the Exo Scalper
Introducing the Exo Scalper, a technologically advanced forex trading solution meticulously crafted for major currency pairs. This innovative trading algorithm integrates a customizable price channel strategy with the analytical capabilities of the MACD indicator, facilitating data-driven precision in trade execution.
Innovative Strategy Fusion: The Exo Scalper seamlessly combines a customizable price channel strategy with the analytic

StableGold is a fully automated expert advisor. The mechanism of this system uses the principle of scalping and breakout trading strategy.
This EAs has passed 5 years back test of Every tick data (2019-2024).
Key Features
Timeframe: M15
Currency pairs: XAUUSD, GOLD
Initial deposit: $ 500 up
It is recommended to use a low spread ECN Broker, 1:500 leverage
It should be an account with low spread and zero stop level
Parameters
MagicNumber - magic number to set the ID for each EA
Lots - initial
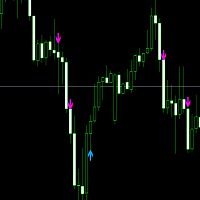
This offer is limited to a temporary period. Entry signal :follow the blue arrow for a buy trade and the Pink for a sell. Buy Trade: When the blue arrow appears, you wait until the candle completely finishes. Then you enter into a Buy Trade as soon as the next candle appears. Now wait until you hit TP1 from the Buy Goals box, then close the trade with a profit. Sell Trade: When the Pink arrow appears, you wait until the candle completely finishes Then you enter into a Buy Trade as soon as the
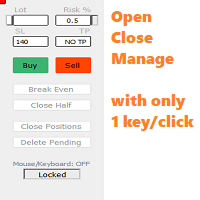
Mouse Keyboard Trade Manager (MK Trade Manager)
This is a simple and efficient Trade manager which allows to open/place, close and manage stop/limit orders (besides normal market orders) at mouse location with just one keyboard shortcut. With the regular MT4 system, it requires 2-3 clicks to place orders and it can make you lose the momentum due to fast markets moves. I think that sometimes it's mandatory to be able to place limit or stops order quickly with just a simple click or a simple hi

Drop Trend is a trend indicator for the MetaTrader 4 trading platform. This indicator allows you to find the most probable trend reversal points. You will not find this indicator anywhere else. A simple but effective system for determining the forex trend. From the screenshots you can see for yourself the accuracy of this tool. Works on all currency pairs, stocks, raw materials, cryptocurrencies.
Are you tired of the constant ups and downs? Do not become a victim of unstable market movements,

"Time Sessions MT4" is another handy tool for forex traders showing the world's major four trading sessions. Time Sessions:
The time in this tool is set automatically according to your local time. It has a moving time flag which moves second by second to the left and shows you the real-time. The panel contains beautiful graphics which is eye-catching. Moreover, you can move the panel wherever on the chart. More Explanations... Hope to enjoy it. At Last: I strongly encourage you to share your th

This is a very nice EA which is running on Trend basis on EMA settings, very good returns, with SL and TP, if trade goes in loss the next trade according to loss can adjust this EA, I am uploading the back test of that EA as well, you can see that as well. You will never find that trending base EA in that price from anywhere, I am using this EA since almost 01 year and on my profiles you can see some live accounts as well.

The Moving Average Convergence Divergence (MACD) is a popular technical analysis tool used by traders and analysts to identify trends and potential buy or sell signals in a financial instrument, such as a stock, currency pair, or commodity. It's essentially a combination of two moving averages, often referred to as the "fast" and "slow" moving averages. Here's how the MACD is calculated: Fast Moving Average (12-period EMA): This is a 12-period Exponential Moving Average (EMA) of the asset's pric

for xau/usd marthingale expert adviser. This EA can also be used by people with low funds. because this EA doesn't take positions when there is a surge or when there is a trend.(it is our logic) and when your position take unrealized profit,it begins "trailing stop" and inclease profit. you can use othersymbols( if you want,please try back test with TDS data) thank you

Keep your equity safe with the Equity Protector.
A purposefully built EA for those running bots on their Funded Account Challenges. Place this bot on a chart, enter in your target in total equity and take comfort in knowing that your bots will cease trading when this goal is achieved. Giving you peace of mind that your equity is safe, even when sleeping!
Try out Equity Protector today!

This indicator is based on the classical indicator Stochastic and will be helpful for those who love and know how to use not a visual but digital representation of the indicator. All TimeFrames RSI MT4 indicator shows values from each timeframe. You will be able to change the main input parameters for each RSI for every TF. Example for M1: sTF1_____ = "M1"; kPeriod1 = 5; dPeriod1 = 3; Slowing1 = 3; stMethod1 = MODE_SMA; Price_Field1 = MODE_MAIN; stMode1 = 0;

Introducing
This Expert Advisor uses a high frequency algorithm working 100% on prop challenges of NOVA FUNDING, NEXT STEP FUNDED e MSOLUTION FF. Promotional price 97.00 USD for a few days only! Reccomended pairs
US30 Timeframe
M1 Backtesting instructions
Premise: live performances are higher than those obtained by backtesting due to the high frequency algorithm.
To perform a backtest as reliable as possible it is necessary to be connected to a demo account on the "MetaQuotes-Demo" server, use E
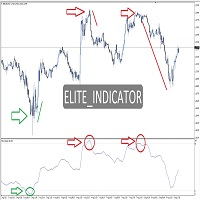
ELT Reversal MT4 (Elite_Indicator) is an indicator for the MetaTrader 4 terminal. . This indicator is based on the Counter-Trend strategy, but also uses Volatility. It is based on showing possible liquidity in the financial market, thus helping traders in their trading. ELT Reversal MT4 (Elite_Indicator) is a visual tool, intuitive, and easy to understand and use.
Recommended time frame for Scalping Trade : M1 M5 M15 Recommended time frame for Swing Trade : M30 upward Better precision:

The TMA Trend Following Bot, b ased on The Moving Averages very own bot that is displayed on his youtube channel.
The TMA Trend Following Bot is a trend based trading strategy. As depicted by The Moving Average on his youtube channel, this bot when optimized can have some serious results, he even has it live on his own challenge accounts. Set your lot size, SL and TP size, your trading window and EMA period and you're ready to go!
Set Files in comments.

Celestia - Your Stellar Companion in Automated Trading
Real Account Celestia EA medium risk https://www.mql5.com/de/signals/2051245
Description: Introducing Celestia, your cutting-edge automated trading companion designed to illuminate your journey in the dynamic world of financial markets. Powered by advanced algorithms and state-of-the-art technology, Celestia stands as a beacon of precision and efficiency in the realm of algorithmic trading. Key Features: Galactic Algorithms: Celestia

This is an EA using the moving average as an indicator.
The parameters are as follows:
Lots=0.1 (number of hands at opening)
MaximumRisk=0.02 (maximum risk coefficient)
DecreaseFactor=3 (Risk Factor)
MovingPeriod=12 (calculated time period)
MovingShift=6 (time period offset)
Trading strategy: When the closing price is higher than the average price and the opening price is lower than the average price, make a purchase order.
When the closing price is less than the average price and the o

The liquidity swings indicator highlights swing areas with existent trading activity. The number of times price revisited a swing area is highlighted by a zone delimiting the swing areas. Additionally, the accumulated volume within swing areas is highlighted by labels on the chart. An option to filter out swing areas with volume/counts not reaching a user-set threshold is also included.
This indicator by its very nature is not real-time and is meant for descriptive analysis alongside other com

Based on envelope and tma with arrows ,, the Bands Sniper shows dynamic support and resistance and also gives entry signals as buy and sell arrows.
Default Settings are based on 1H time frame , contact after purchase for full guide .
Entry Rules : BUY : 1.Candle Closes below both bands 2.Candle Closes back within the 2 bands with 2 up arrows (golden arrow and orange arrow) SELL : 1.Candle Closes above both bands 2.Candle Closes back within the 2 bands with 2 down arrows (golden

Binary Lines is a technical analysis indicator for currencies, commodities, cryptocurrencies, stocks, indices and any financial instruments. Can be used for binary options or Forex scalping. Shows entry and exit points at fixed intervals and provides traders the necessary information about the results of possible transactions. Entry points are formed at the very beginning of the candle, in the direction of the MA line, duration
trades in bars can be adjusted manually and adjusted to any financia

ICT London is a game-changing trading strategy which is based on (ICT Judas) that harnesses the unique dynamics of the Asian trading session to identify profitable opportunities in the subsequent London session. Backed by advanced AI technology and high-level calculations, this strategy excels at detecting the direction of the Asian session's market movement and capitalizing on potential market reversals. It performs best on EURUSD by default settings. It is also profitable on other pairs, pl

Gumper Options USES THE TREND WAVE INDICATOR AND IT CAN IDENTIFY THE BEGINNING AND THE END OF A NEW WAVE TREND MOVEMENT.
AS AN OSCILLATOR, THE INDICATOR IDENTIFIES THE OVERBOUGHT AND OVERSOLD ZONES.
IT WORKS GREAT TO CATCH THE SHORT TERM PRICE REVERSALS AND USES A MARTINGALE STRATEGY TO CLOSE ALL TRADES IN PROFIT.
USE DEFAULT SETTINGS ON H1 OR HIGHER TIME FRAME ON ANY PAIR FOR MORE ACCURATE TRADES
WHY THIS EA :
Smart entries calculated by 5 great strategies The EA can be run on even a $200

The Wamek Support and Resistant (WSR) Indicator is a remarkable tool that stands out in the world of technical analysis. It sets itself apart by cleverly combining price action and leading indicators to delineate support and resistance levels with a high degree of accuracy. Its unique feature is its adaptability; users can fine-tune the indicator by adjusting input parameters, enabling them to create customized support and resistance levels that suit their trading strategies. Notably, one of WSR

for xau/usd marthingale expert adviser.
This EA can also be used by people with low funds. because this EA doesn't take positions when there is a surge or when there is a trend.(it is our logic) and when your position take unrealized profit,it begins "trailing stop" and inclease profit. you can use othersymbols( if you want,please try back test with TDS data) thank you

introduction: Hello, I present to you the advanced and final version of the "Binary Hedger FV" Expert Advisor. I won't delve into extensive details about the EA's concept, as I've covered all the information in the initial version or what can be referred to as the EA's trial version, accessible through the following link: https://www.mql5.com/en/market/product/93688?source=Site +Market+My+Products+Page In this presented version, you have a comprehensive and complete release that incorporates all

A simple yet effective robot built on a single MACD indicator . This demonstrates that even simple robots using a standard indicator can be effective traders. The robot analyzes the MACD indicator and conducts trading fully automatically. All trading processes are automated. You just specify the Lot size, set the robot on EURUSD M5, and the robot starts trading. Settings do not need to be changed for the EURUSD M5 currency pair. For other currency pairs, settings can be found through parameter o

The indicator is designed to detect and visualize diamond Gann waves, a specific pattern derived from Gann theory. It provides traders with insights into potential market reversals by drawing points (P) based on the ABC points of the pattern. Additionally, the indicator draws vertical lines from the predicted points (P) to help traders identify potential reversal points more easily. Indicator Features: Use_System_Visuals: This parameter enables or disables the usage of the system's visual theme

This indicator has been designed to integrate with the Elliott Wave theory, providing two distinct methods of operation: Automatic Work: In this mode, the indicator operates autonomously by detecting all five motive waves on the chart according to Elliott Wave theory. It offers predictions and identifies potential reversal zones. Additionally, it has the capability to generate alerts and push messages to notify traders of significant developments. This automated functionality streamlines the pro

The "Fibo Star" indicator is designed to visualize Fibonacci Fans in a star-like pattern on your trading chart. These Fibonacci fans are a powerful tool for analyzing price movements and can offer insights into potential support and resistance levels. This indicator comes equipped with a user-friendly control panel, aiming to simplify the process of drawing and configuring the fans, thus saving you time and effort. Usage Instructions: This indicator is meant for manual usage. To effectively util

Harmonic Patterns Indicator: Enhancing Harmonic Trading Analysis The Harmonic Patterns Indicator is a powerful tool designed to identify harmonic patterns on your trading chart using both manual and automatic detection methods. Main Features and Functions: Manual and Automatic Detection: This indicator empowers you to identify harmonic patterns through both manual and automatic methods. Whether you draw the patterns yourself or let the indicator do it for you, it's a versatile tool to enhance y
MetaTrader Market - trading robots and technical indicators for traders are available right in your trading terminal.
The MQL5.community payment system is available to all registered users of the MQL5.com site for transactions on MetaTrader Services. You can deposit and withdraw money using WebMoney, PayPal or a bank card.
You are missing trading opportunities:
- Free trading apps
- Over 8,000 signals for copying
- Economic news for exploring financial markets
Registration
Log in
If you do not have an account, please register
Allow the use of cookies to log in to the MQL5.com website.
Please enable the necessary setting in your browser, otherwise you will not be able to log in.